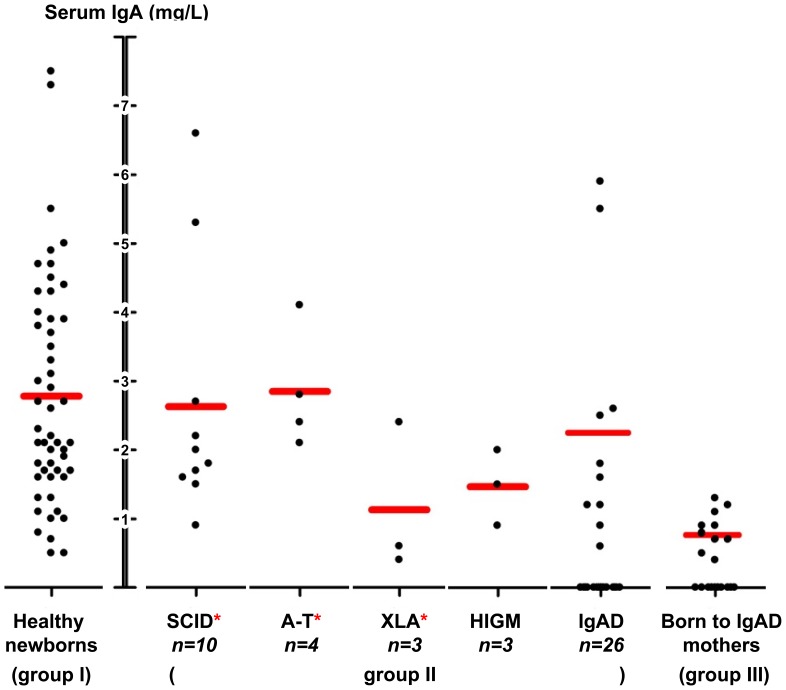
Figure 2. IgA levels in eluates from neonatal DBSS. Mean IgA levels per group are marked as horizontal red bars.
One SCID patient was excluded due to extremely high levels of IgA in the DBSS eluate. SCID, A-T and XLA DBSS have previously shown to result in abnormal test results in the TREC/KREC assay and have been indicated by red asterisks [26], [27].

