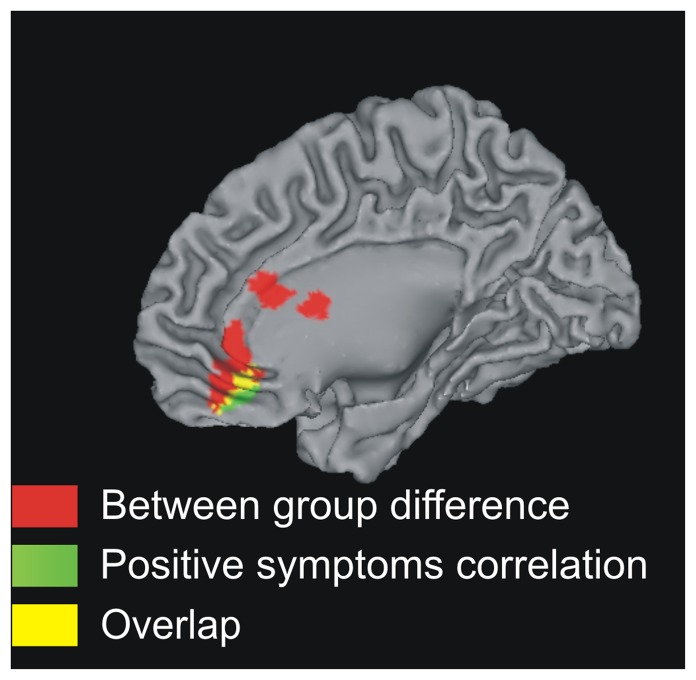
Figure 2. Correlation with positive symptoms in schizophrenia.
Red: controls showed significantly stronger neural responses to increasing social exclusion than patients. Green: mPFC correlation between increasing exclusion and brain activity modulated by positive symptoms. Yellow: overlap between the Red and Green regions.

