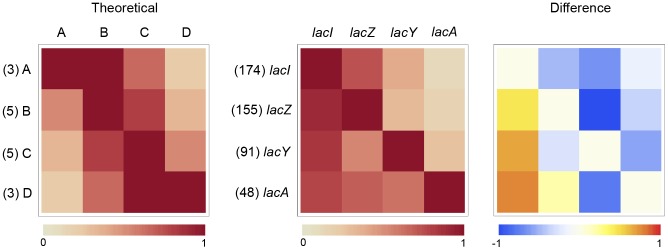
Figure 4. Coincidence heat map for Lac operon LMNAST stringent search hits.
Each shaded index represents the normalized frequency of hits containing the row gene that also contain the column gene out of the total number of hits containing the row gene, as denoted by (#). The matrix on the left is a representation of an unbiased set of evenly distributed homologs (AB, BC, CD, ABC, BCD, and ABCD). The middle matrix is the actual coincidence data. The matrix on the right is a heat map of the difference between the two. LacI is heavily over-represented according to the difference matrix. LacY occurred less than would be expected according to a random distribution.

