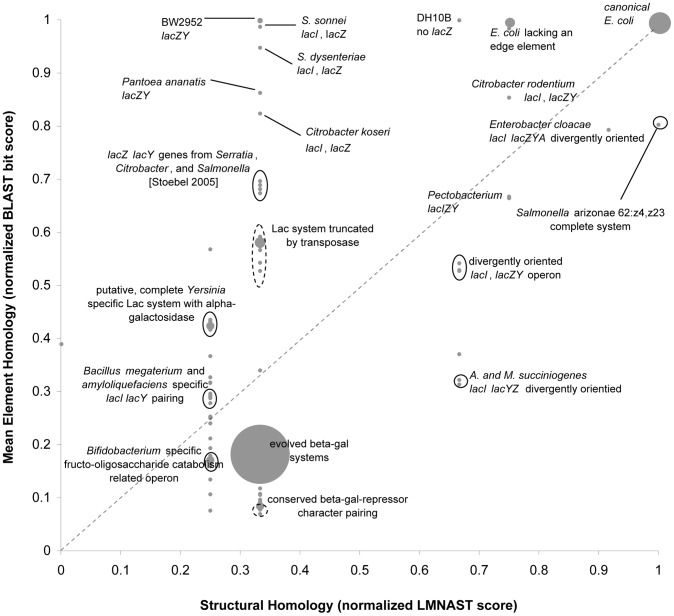
Figure 5. 2D Similarity Plot of Lac operon LMNAST stringent search hits overlaid with attributed annotation.
Each gray dot represents the homology coordinate of a hit. The size of the dot scales directly with the number of hits at the same coordinate. The dashed line is a 1∶1 line along which hits have the same degree of homology by both BLAST and LMNAST measures. Seemingly vertical displacements may imply horizontal gene transfer, while horizontal displacements may imply gene loss or arrangement within the same or proximal species. Ovals indicate a clustering of similarly annotated hits. Dashed ovals denote cases where only the majority of hits therein share the labeled Genbank annotation. Here, the dominant features are systems mirroring the original structure and the evolved beta-galactosidase system. Very little HGT is apparent while gene loss and rearrangement are ostensibly more common.

