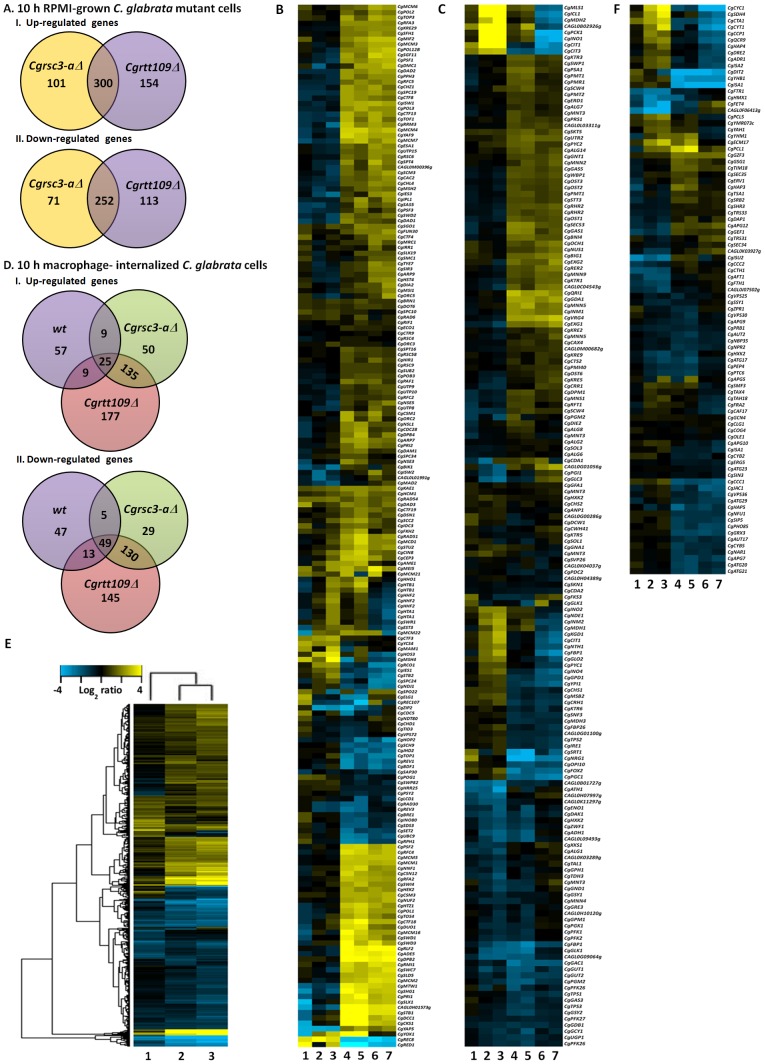
Figure 4. Differential gene expression pattern of wt, Cgrsc3-aΔ and Cgrtt109Δ cells upon macrophage ingestion.
A. Venn diagram depicting the overlap between up-regulated and down-regulated genes in RPMI-grown Cgrsc3-aΔ and Cgrtt109Δ cells. B. Heat maps of expression levels of clustered and differentially expressed genes, belonging to the GO category of chromatin remodeling, in macrophage-internalized wt (1), Cgrsc3-aΔ (2) and Cgrtt109Δ (3) compared to the corresponding RPMI-grown cells. Lanes 4–7 represent the expression of differentially expressed genes in macrophage-internalized Cgrsc3-aΔ (4) and Cgrtt109Δ (5) and RPMI-grown Cgrsc3-aΔ (6) and Cgrtt109Δ (7) compared to the macrophage-internalized and RPMI-cultured wt cells, respectively. Scaled expression values are colour-coded according to the legend on the left. C. Heat maps of clustered and differentially expressed genes belonging to the GO category of cellular respiration. D. Three-way Venn diagram describing the overlap between up-regulated and down-regulated genes in macrophage-internalized wt, Cgrsc3-aΔ and Cgrtt109Δ cells compared to the corresponding RPMI-cultured cells. E. Dendrogram depicting hierarchical clustering of 875 differentially-expressed genes in macrophage-internalized wt (1), Cgrsc3-aΔ (2) and Cgrtt109Δ (3) compared to the corresponding RPMI-grown cells. F. Heat maps of clustered and differentially expressed genes belonging to the GO category of iron homeostasis.

