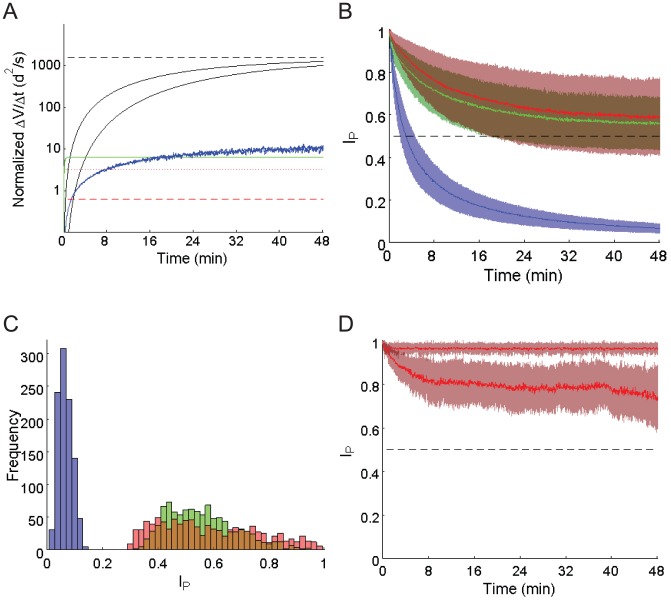
Figure 3. Place stability without vision in a circular arena.
A. Predicted rate of positional variance change (ΔV/Δt) using iPI in an open field with small HD error ( , black solid lines – consistent with rat HD tuning error without vision) and moderate HD error (
 , green solid lines – approximately equal to intended turns of the simulated trajectories inside experimental arenas). Asymptotic variance rates (dashed lines) are shown. From simulation (blue lines), the positional variance rates (with respect to true position) were found assuming an intended trajectory with moderate tortuosity (
 ), and heading error
  . Limits defining navigation failure (dotted and dashed red lines) are shown. Intentional and erroneous turn distributions are Gaussian, with constant step size
  . See text for further details. B. Place stability index values (mean ± s.d., 103 trials) in a circular arena of 76 cm radius. The conditions were iPI only (blue), iPI and boundary memory (green), iPI and boundary memory and contact information (red). Chance level is shown (dashed line). See Methods for details on the simulation of quasi-random trajectories. C. Frequency histogram of place stability values following 48 minutes without vision (colour code as per B). D. Comparison of the top 10% of place stability in square (upper line) and circular (lower line) arenas, with boundary memory and boundary contact information (mean ± s.d., 102 trials).

