
Figure 3. Maximally unstable perturbation wave number  for homogeneous steady states with total density
  .
.
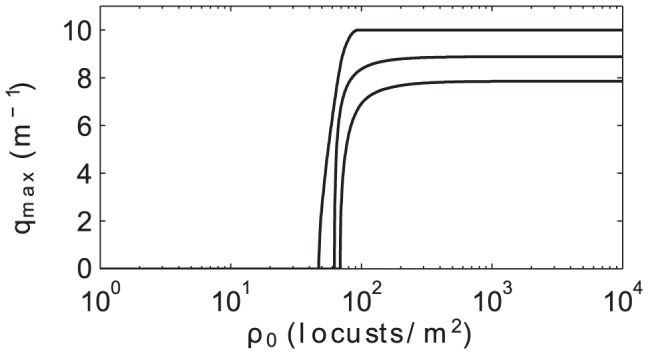
Similar to Fig. 1, the middle, bottom, and top curves show results for the 25th and 75th percentile as computed from 10,000 random parameter draws centered around our default parameter set. At low densities, there are no unstable perturbation wave numbers. Just past the critical density  ,
,  increases rapidly and then plateaus. For our default parameters,
  asymptotes to
  corresponding to a length scale of
  .
.