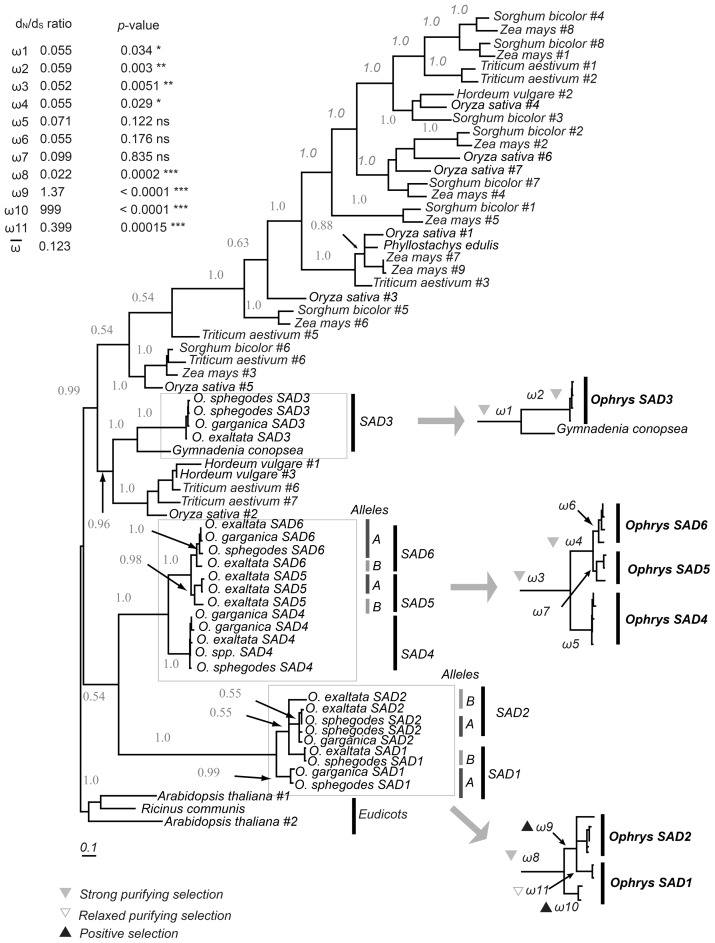
Figure 1. Bayesian inference phylogenetic tree of monocot SAD homologs and eudicot outgroup.
Numbers indicate posterior probabilities (where >0.5) above branches. Ophrys SAD homologs and their assignment to different allele groups are highlighted and ω = d N/d S ratios for branches of interest indicated. A black upward triangle indicates significant positive selection; a gray downward triangle indicates purifying selection, and a non-filled triangle indicates relaxed purifying selection. The inset lists the ω-values, associated p-value, and significance (*, p<0.05; **, p<0.01; ***, p<0.001).

