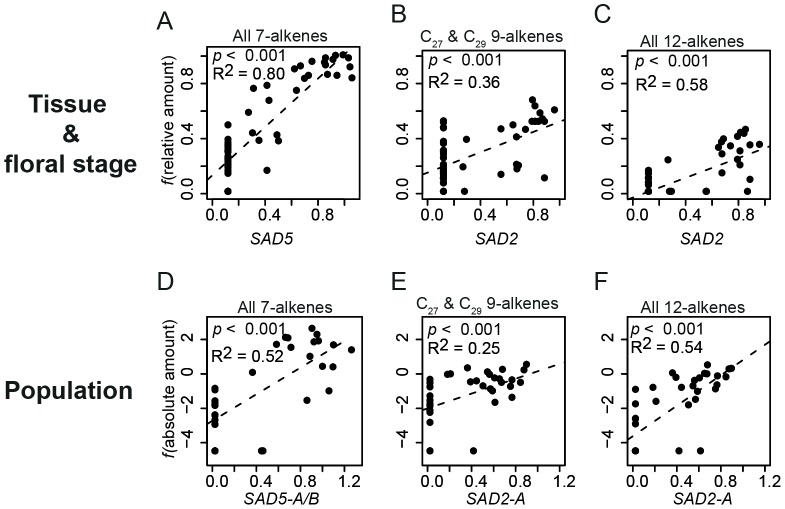
Figure 2. Regression of normalized desaturase gene expression with alkenes.
(A–C) Relative amount of alkenes was used after f(x) = arcsin x0.5 transformation for tissues and floral stages of O. exaltata (A) and O. sphegodes (B,C). (D–F) Absolute amount of alkenes (in µg) was used after f(x) = ln (x+0.01) transformation for population data from three species. For both datasets, normalized SAD expression was used after f(x) = x0.5 transformation. Adjusted R2 is indicated in each graph. (A,D) Correlation of all (C21-C29) 7-alkenes with SAD5; (B,E) Correlation of C27+C29 9-alkenes with SAD2 expression; (C,F), Correlation of all (C25-C29) 12-alkenes with SAD2 expression.

