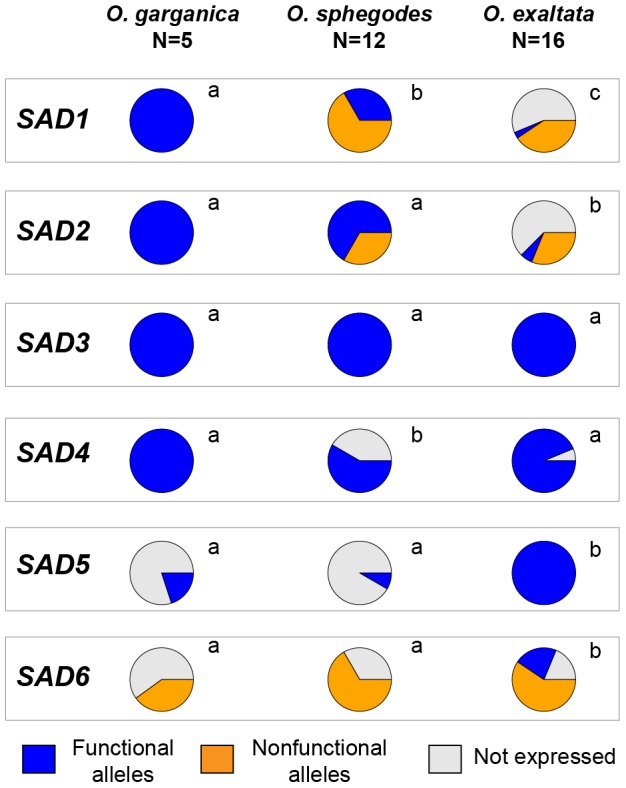
Figure 3. Distribution of SAD allele occurrence in three species.

Color indicates different allele groups (blue: putatively functional alleles; orange: putatively nonfunctional alleles; gray: alleles not expressed in a given species). Different letters beside pie charts indicate statistical difference (p<0.05; χ2 test).
