
Figure 4. Allelic gene expression and alkene production in different species.
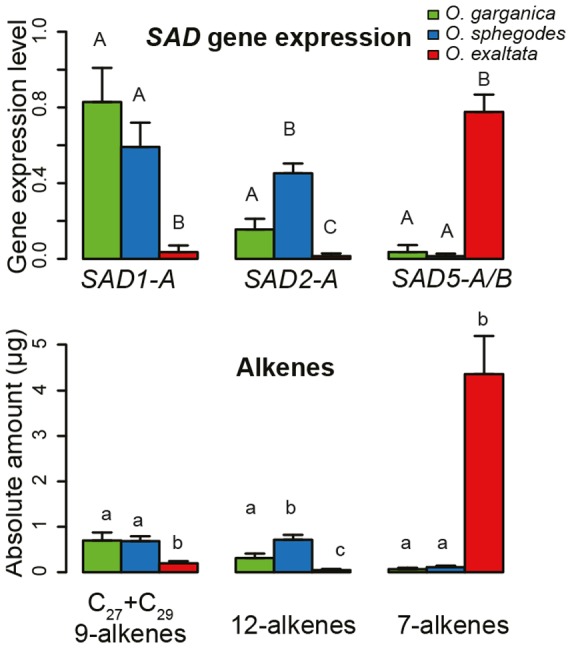
Top, gene expression of different SAD alleles; Bottom, alkene levels. Colors indicate species (red, O. exaltata; green, O. garganica; blue, O. sphegodes). Error bars show standard error. Different letters indicate significant differences among species for each allele (p<0.05; ANOVA).