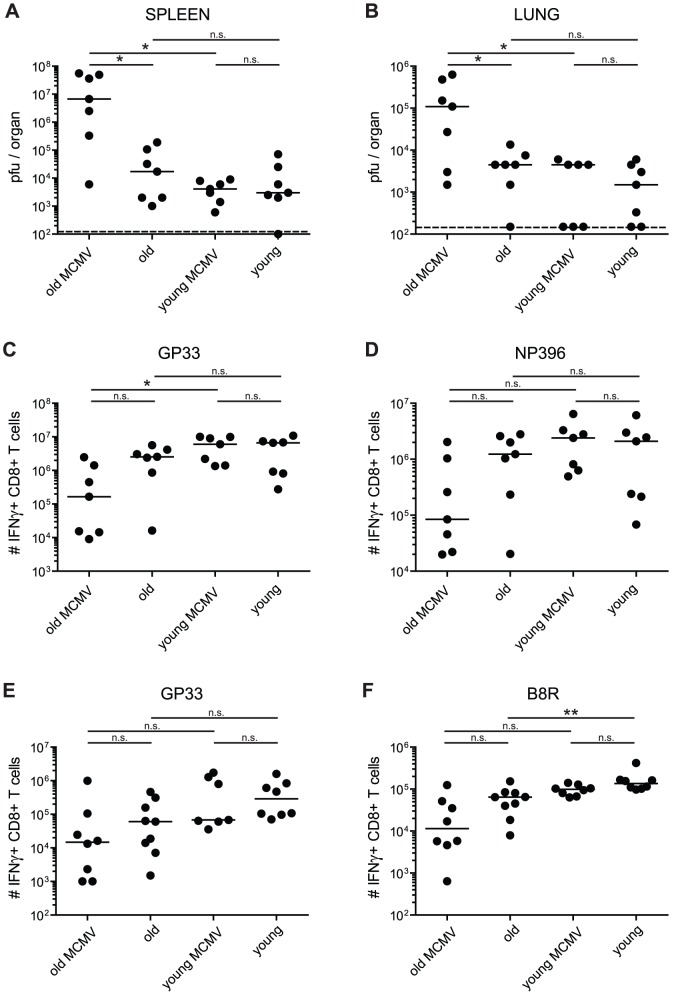
Figure 1. LCMV-clearance and LCMV- or VACV-specific CD8+ T cell responses in young and old mice with/without latent MCMV-infection.
A–D: uninfected or MCMV infected (107 pfu MCMV-Δ157 i.v.) young (4 or 6 months old; 2 or 4 months p.i.) and old (15 or 22 months old; 11 or 18 months p.i.) C57BL/6 mice were infected with 2×10³ pfu LCMV-WE i.v. Eight days after infection, LCMV titres were determined in spleen (A) and lung (B) by plaque forming assay and the virus-specific CD8+ T cell response was quantified by ICS in the lung for GP33-specific (C) and NP396-specific (D) CD8+ T cells. E, F: young (4 months old, 2 months p.i.) and old C57BL/6 mice (25 or 28 months old, 23 or 26 months p.i.) with and without latent MCMV-infection were infected with 5×10⁶ pfu VACV-GP i.p. At the peak of the response on day 6, GP33-specific (E) and B8R-specific (F) CD8+ T cells from the lung were quantified by ICS after in vitro re-stimulation with the respective peptide. Circles indicate total numbers of epitope specific CD8+ T cells of individual mice, horizontal lines show the medians of an individual group. Data are pooled from two independent experiments. ANOVA followed by Bonferroni post-analysis was used to determine significant differences between the displayed medians of each group (* p<0.05; ** p<0.01; ns = not significant). The dotted line corresponds to the detection limit of the assay. p.i., post infection.

