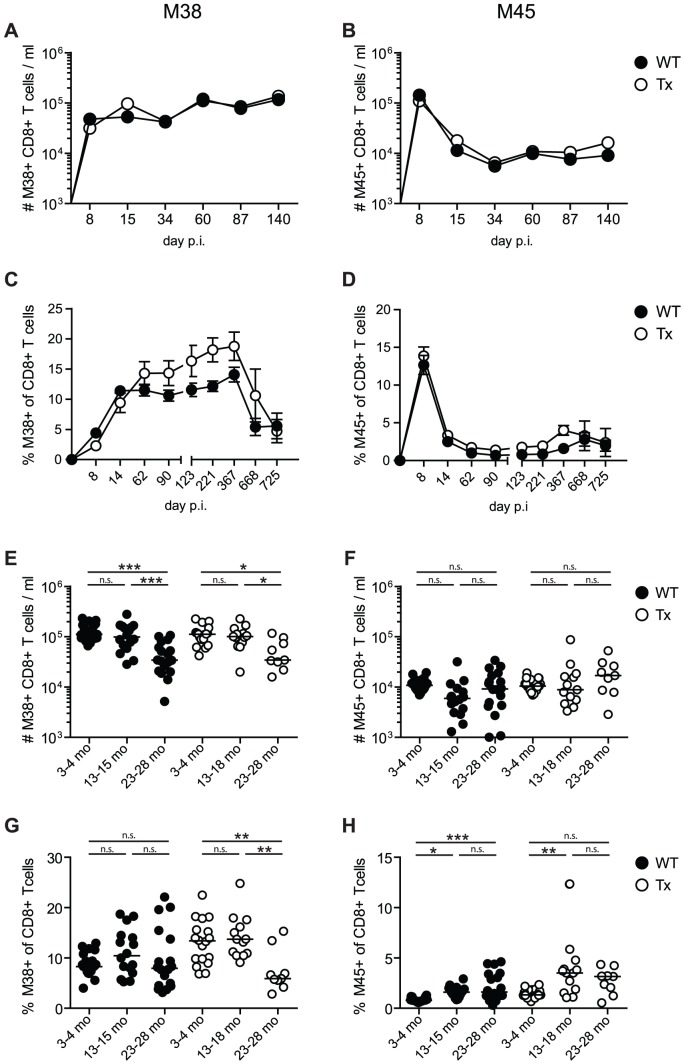
Figure 2. Long-term analysis of MCMV-specific CD8+ T cell responses in thymectomised and non-thymectomised mice.
C57BL/6 mice were thymectomised at age of 4–5 weeks. Two to 3 weeks later, Tx mice (open circles) and non-Tx wild type mice (wt, closed circles) were infected with 107 pfu MCMV-Δ157 i.v. The MCMV-specific CD8+ T cells were quantified in the blood by tetramer staining and analysed by polychromatic flow cytometry using beads for direct measurements of total numbers. A–D: longitudinal analysis of the total number of M38- (A) and M45-specific (B) CD8+ T cells in the blood. Longitudinal analysis of the frequencies of M38- (C) and M45-specific (D) CD8+ T cells in the blood at different time points after MCMV infection. Circles indicate the mean of 8–11 (A, B) or 5–7 (C, D) mice per group, error bars indicate the SEM. Figure E–H: cross-sectional analysis of the total numbers (E, F) and the frequencies (G, H) of M38- (E, G) and M45-specific (F, H) CD8+ T cells in the blood of young (3–4 months), middle-aged (13–18 months) and old C57BL/6 mice (23–28 months). Data of the cross-sectional analysis were pooled from three independent experiments. ANOVA followed by Bonferroni post-analysis was carried out for calculating significance (* p<0.05; ** p<0.01; *** p<0.001; ns = not significant). p.i., post infection.

