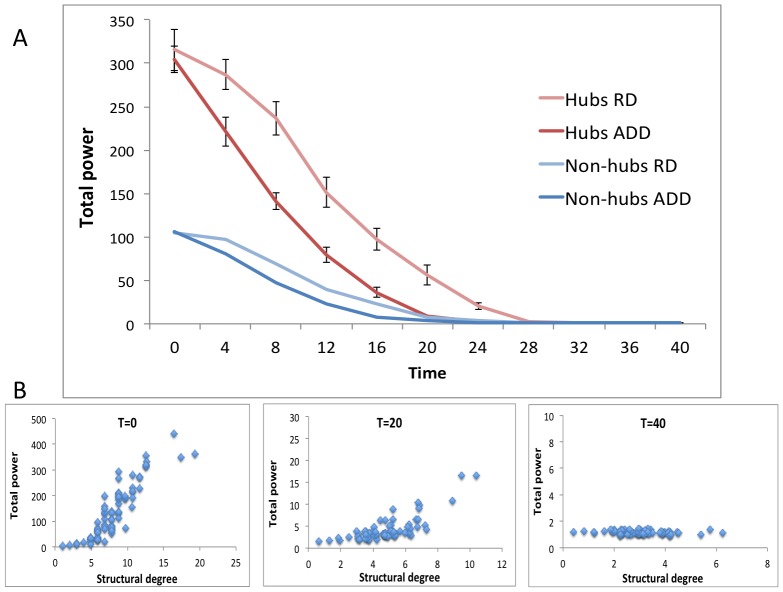
Figure 3. Effect of ADD on total power.
A: Average total power of hub and non-hub regions plotted over time, for both the ADD and RD procedure. Error bars indicate standard error of the mean. B: Correlation between structural degree and total power for all regions at different time points during ADD.

