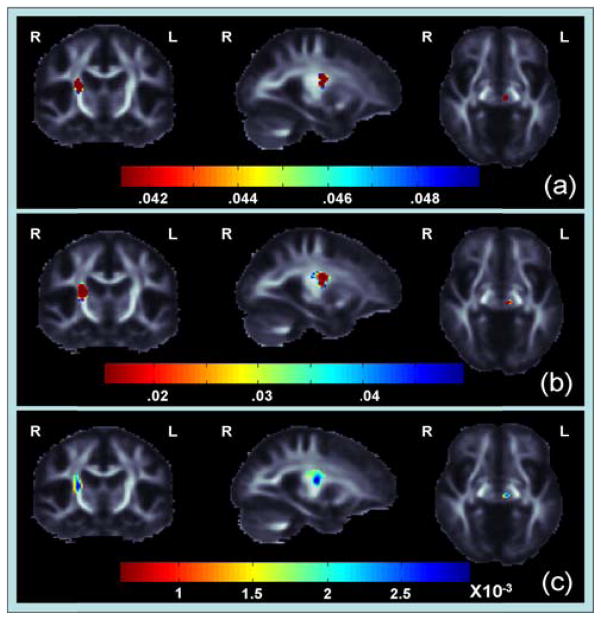
Figure 2.
(a) These p-maps show regions where CPL and MCC are joint pr redictors of FA differences (corrected p<0.05 [21]) (b) These p-maps show regions where MCC is significantly associated with change in FA (c) These maps show Beta-values (non-normalized slope of regression coefficient in units of imaging measure per unit of predictor) within regions where MCC has a significant positive correlation with changes in FA.

