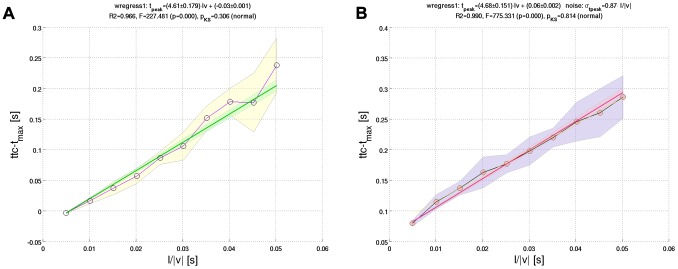
Figure 3. Masking of the m-Tau nonlinearity by noise.
The experimental data from Gabbiani et al.
[26] suggest a linear relationship between relative time of peak firing rate  and the half-size to velocity ratio
  . The big shaded areas indicate one standard deviation
  from the mean value of
  . Notice the increase in
  with increasing
  . (a) Resampled Figure 4a from Reference [26] (p. 1128). The locusts were stimulated by approaching dark squares with different sizes and velocities, such that various values of
  were covered. The circle symbol for each
  represents the mean
  of neuronal response curves across
  DCMD neurons. The result of a weighted least square regression fit reported by Gabbiani et al. had slope
  and intercept
  . With the manually resampled data points shown here, we obtained
  and
and  , respectively. The light green shaded area indicates one standard deviation of slope. Additional statistical parameters of our weighted least square fit are shown above the figure. (b) An example of fitting a straight line to
  averaged random trials of the “noisified” equation (2) with
  . “Noisifying” means that Gaussian noise with standard deviation
  was added to
  (according to equation 8, page 1129 in [26]). The noise blurs the nonlinear character of the m-Tau function and makes it appear linear. The light red shaded area indicates one standard deviation of slope. Further simulation results are presented in Text S2.

