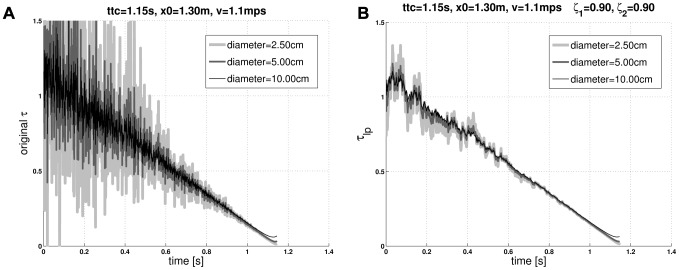
Figure 6. Limit functions of the corrected m-Tau function.
The corrected m-Tau -function  responds similar to
  , but with an improved noise suppression performance, as long as parameter values
  (
( and
and  ) are suitably chosen. More precisely,
  is constrained by the limit functions
  and
and  . This means that corrected m-Tau can approach the former or the latter function for the corresponding (extreme) values of
  , but typically
  will perform somewhere between the two limit functions. For the simulations shown in this figure, uncorrelated normal-distributed noise was added to the angular variables
  and
and  . Each curve represents a typical random trial, where noise was identical for all curves. The different shades of gray indicate different object diameters, as indicated in the legends. (a) “Normal”
  function, which is the limit function approached by
  for
for  . Noise suppression is poor. Notice that the displayed range has been truncated so as to match it to the range of the figure on the right-hand side. (b) The
  function is the limit function that is approached for
  . It has an excellent noise suppression performance, owing to lowpass filtering of angular variables (
 , c.f. equation 4). Further details are presented in Text S3.

