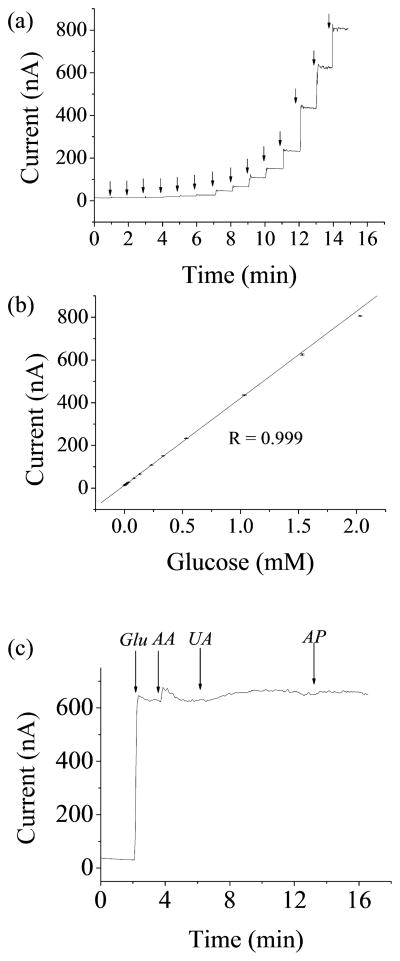
Figure 5.
(a) Representative amperometric response to glucose in the whole linear range (1 μM – 2 mM) for GrOx/Pt-black microbiosensors at +500 mV (arrows (from left to right) indicated addition of 1, 1, 5, 5, 10, 10, 50, 50, 100, 100, 200, 500, 500, and 500 μM glucose). (b) Linear regression for (a) (error bars represented standard error of the mean). (c) Representative amperometric response to 2 mM glucose (noted as “Glu”), 125 μM ascorbic acid (AA), 330 μM uric acid (UA), and 130 μM acetaminophen (AP) for GrOx/Pt-black microbiosensors.

