Figure 1.
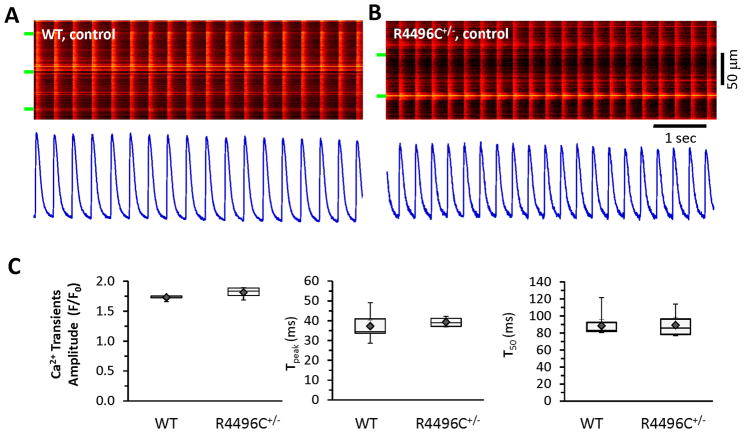
In situ confocal Ca2+ imaging in WT and RyR2R4496C+/− hearts: normal Ca2+ transients under resting conditions. A–B, Autonomous, synchronized Ca2+ transients driven by sinus rhythm in (A) WT and (B) RyR2R4496C+/− hearts. Spontaneous Ca2+ waves or Ca2+ sparks were rarely detected during steady state beating under resting conditions. Bottom panels are spatial averages of Ca2+ signals from corresponding images. C, Boxplots of Ca2+ transients (amplitude, time to peak, and T50 relaxation), ◆ and error bars inside the box denotes mean±SE. N=5–7 hearts, n=54 or 82 frames of transients (most of frames include multiple myocytes) for WT and RyR2R4496C+/−, respectively. Green bars indicate edges of myocytes in this and subsequent figures.

