
Figure 6.
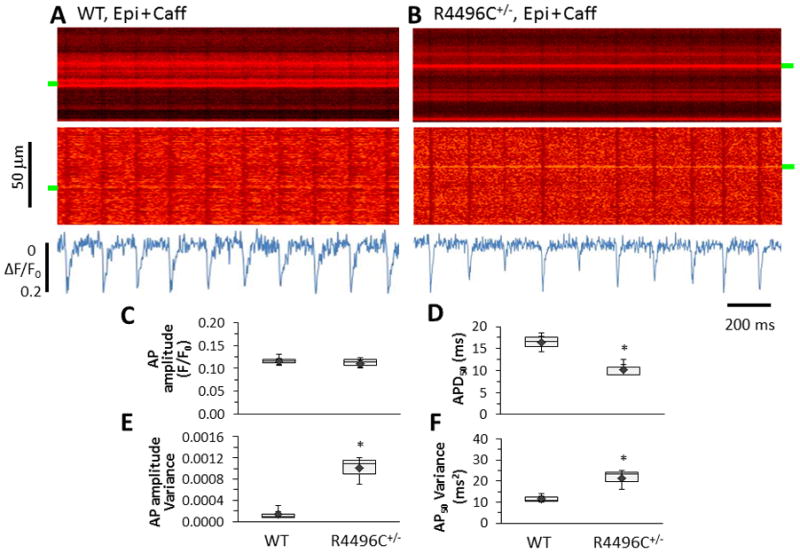
In situ imaging of myocyte APs in intact hearts. A–B, Representative examples of ANNINE-6plus fluorescence from WT and RyR2R4496C+/− hearts perfused with epinephrine plus caffeine. Top to bottom: raw images, images after normalization, and spatial average of ANNINE-6plus fluorescence. RyR2R4496C+/− myocytes displayed beat-to-beat variation in AP morphology. C–D, Summary of AP amplitude (ΔF/F0) and APD50 in boxplots. E–F, Boxplots of variance of AP amplitude and APD50. * p<0.05, n=4 and 5 for WT and RyR2R4496C+/− hearts, and 326 or 213 AP events for WT or RyR2R4496C+/− hearts, respectively.