
Fig. 3.
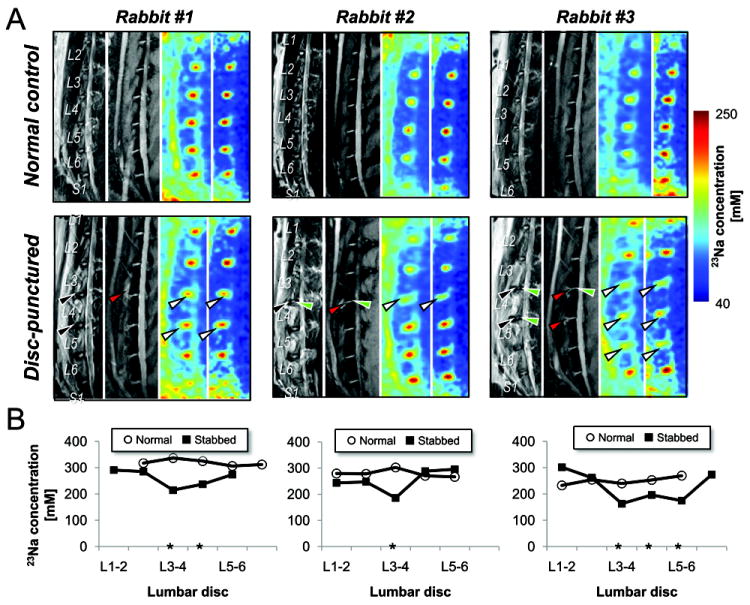
1H- and 23Na-MRI of three representative disc-punctured rabbits discs. A, TSE, DESS and 23Na (of single slice and projection in LR depth direction) MR images from left to right panel. (Upper panels) before and (lower panels) twelve-week after stab surgery. Black and red arrowheads indicate the edema regions caused by the stab injury, and white arrowheads represent the region of sodium decrease in the degenerated discs. B, Plot of [23Na] changes associated with the degeneration from each three subject. Asterisk (*) points the discs with sodium decrease due to the stab.