
Fig. 6.
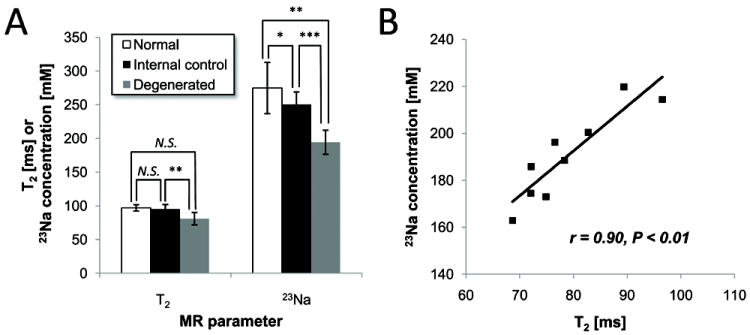
T2 and [23Na] in discs between different disc groups. A, T2 and [23Na] between the normal, the internal-control and the degenerated discs. B, Correlation of T2 and [23Na] in the degenerated discs. Correlation coefficient between T2 and [23Na] is r = 0.90, P < 0.01 (N = 9 discs). * P < 0.1, ** P < 0.05, *** P < 0.001, N.S. non-significant.