Figure 4.
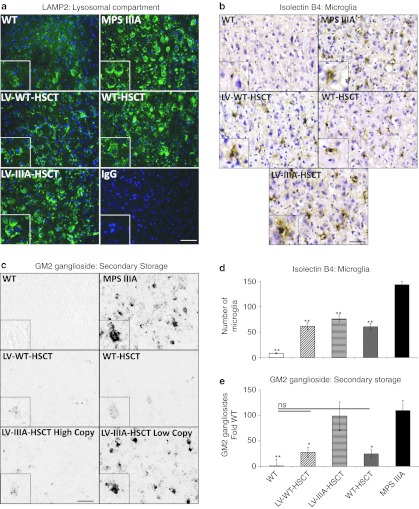
Neuropathology is improved by all treatments. (a) Representative sections of brain cortex (layer IV/V) from –0.84 mm relative to bregma were stained with LAMP2 (green) to demonstrate lysosomal compartment size and DAPI (blue) to highlight nuclei. (Bar = 50 µm in low power and 100 µm in high power insert). (b) Representative images of cerebral cortex layer IV/V from around –0.46 mm relative to bregma showing isolectin B4-positive microglia (brown) and nuclei (blue) and (c) GM2 ganglioside (black). Two images of lentiviral (LV)-IIIA HSCT are shown, one with a high copy and one with a low copy to demonstrate the variable response in this group (Bar = 50 µm in low power and 100 µm in high power insert). (d) The number of microglia were counted, and (e) GM2 ganglioside storage was quantified using Image J from two fields of view (×20 objective) per brain section, four sections per mouse (n = 5 mice per group). Error bars represent the SEM. Significant difference to mucopolysaccharidosis IIIA (MPS IIIA) is demonstrated with *P < 0.05, **P < 0.01, and ***P < 0.001. Where treatments result in significant improvement to MPS IIIA and there is no significant difference to wild-type (WT) this is shown by a line and ns. Groups were; WT untreated (WT), WT donor cells transduced with LV-N-sulfoglucosamine sulfohydrolase (SGSH) into MPS IIIA recipients (LV-WT-HSCT), MPS IIIA donor cells transduced with LV-SGSH into MPS IIIA recipients (LV-IIIA-HSCT), WT to MPS IIIA (WT-HSCT) and MPS IIIA untreated (MPS IIIA). The representative high copy LV-IIIA-HSCT had a copy of 0.14 copies per white blood cell and the low copy contained 0.08 copies per white blood cell. The average copy number of the biochemistry/histology group was 0.47 integrations per white blood cell for LV-WT-HSCT and 0.11 integrations for LV-IIIA-HSCT groups.

