Figure 2.
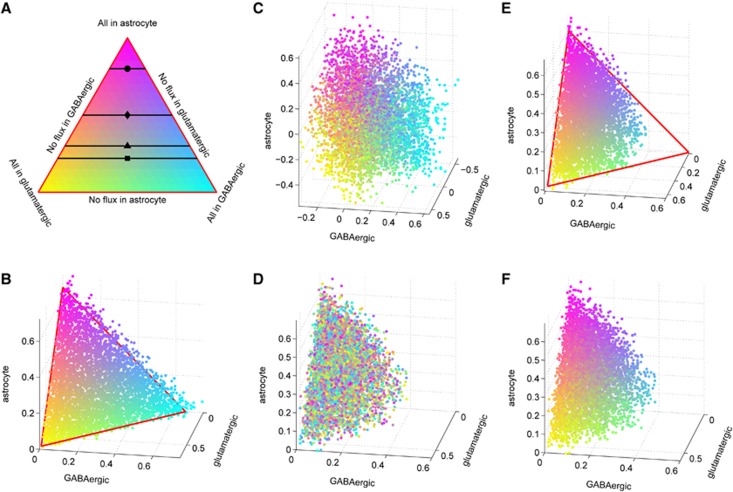
(A) A color-coded three-dimensional scatter plot of twice the rates of glucose uptake from extracellular space (ECS) in μmol/g per minute in the three cells from the computed sample, colored as follows: vectors where glucose is taken up by GABAergic neurons are cyan, by astrocytes are magenta, and by glutamatergic neurons are yellow, and the color coding of each point in the triangle defined by these three extreme cases is determined as a convex combination of these basic colors. The horizontal lines indicate different literature values of glucose partitioning: Gjedde (2007) (•), Jolivet et al (2010) (⧫), Mangia et al (2011) (▴), Simpson et al (2007), and DiNuzzo et al (2010) (▪). (B) A color-coded scatter plot of the three vectors indicating the glucose uptake in μmol/g per minute from ECS of the three cell types computed from a sample corresponding to the awake steady state. (C) Three-dimensional (3D) scatter plot of lactate efflux rate in μmol/g per minute from each cell type colored according to the glucose uptake. (D) 3D scatter plot of oxidative phosphorylation fluxes in μmol/g per minute, with color coding based on glucose partitioning. The unorganized color distribution of the scatter plot shows that the rate of oxidative activity in each cell type does not depend directly on glucose partitioning. (E) 3D scatter plot of the difference between glycolytic pyruvate production and lactate dehydrogenase in μmol/g per minute. The assignment of the color follows the rule in panel A. (F) 3D scatter plot of oxidative phosphorylation fluxes in μmol/g per minute, with color coding based on (E). The organization shows that oxidative metabolism is correlated with difference between glycolytic pyruvate production and lactate dehydrogenase. GABA, gamma aminobutyric acid.

