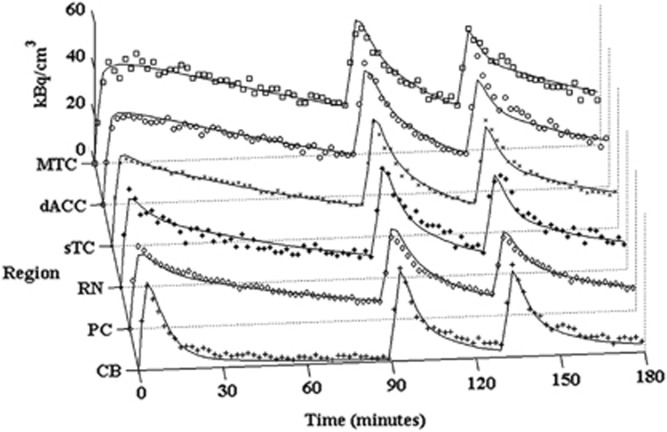
Figure 4.
Measured time-activity curves (not corrected for decay) and model predictions (solid line) for subject M4 in the regions of the MTC (□), dACC (○), sTC ( × ), RN (*), PC (◊), and CB(+). MTC, mesial temporal cortex; sTC, superior temporal cortex; PC, parietal cortex; dACC, dorsal anterior cingulate cortex; CB, cerebellum; RN, raphe nucleus.

