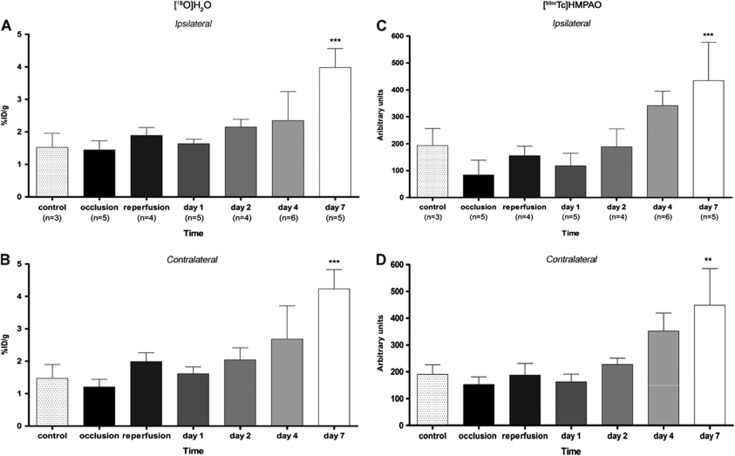
Figure 2.
Time course of the [15O]H2O PET and [99mTc]HMPAO SPECT signals during and after ischemia in the area ipsilateral (A, C) and contralateral (B, D) to middle cerebral artery occlusion (MCAO). Statistically different from control: **P<0.01, ***P<0.001. ID, injected dose; PET, positron emission tomography; SPECT, single photon emission computed tomography; [99mTc]HMPAO, [99mTc]hexamethylpropylene-amino-oxime.

