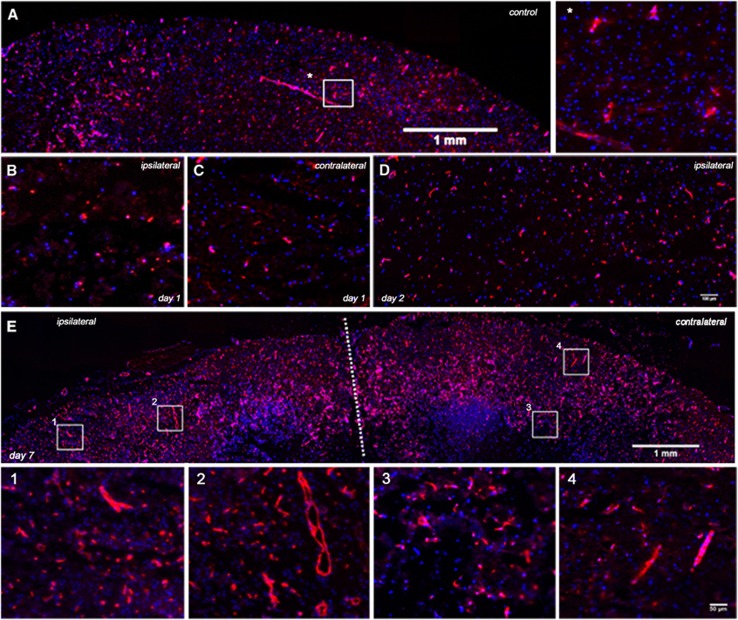
Figure 4.
Evolution of CD31 expression in vessels after cerebral ischemia. Immunofluorescent labeling of CD31 (red) and DAPI (blue) in (A) the cerebral somatosensory cortex from a control brain, and after middle cerebral artery occlusion (MCAO) at day 1 in the ischemic area (B) and contralateral to lesion hemisphere (C), at day 2 in the ischemic side (D) and at day 7 in both hemispheres (E). Boxed areas and * in panel A and 1 to 4 in panel E are also shown at a higher magnification correspondingly. Boxed areas correspond to representative areas of cortical ischemic injury (1), surrounding area to the infarction (2), and contralateral hemisphere (3 and 4). The color reproduction of this figure is available at the Journal of Cerebral Blood Flow and Metabolism journal online.

