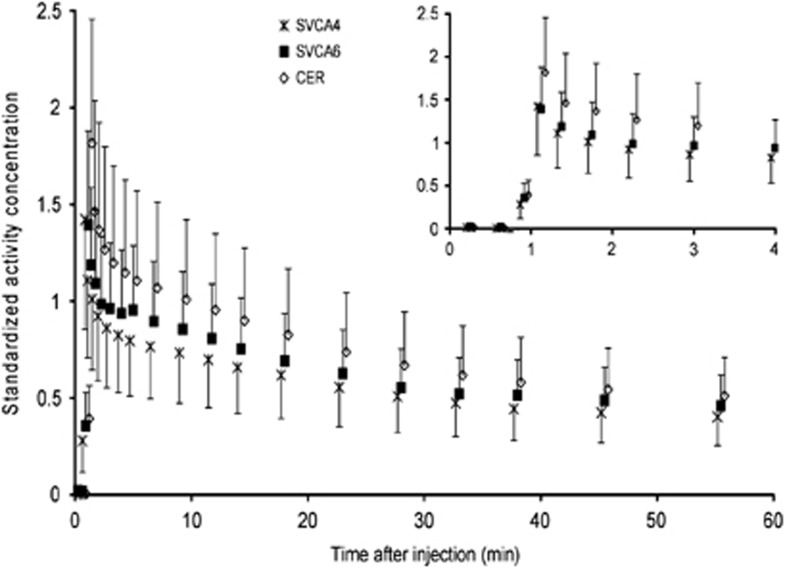
Figure 2.
Average standardized reference tissue time-activity curves (TACs) over all eight AD subjects. Curves represent manually drawn gray+white-matter cerebellum (CER), and those extracted automatically using SVCA4 and SVCA6. The insert highlights the first 4 minutes. TACs were normalized for injected dose and patient weight before calculating averages (symbols) and one standard deviation (error bars).

