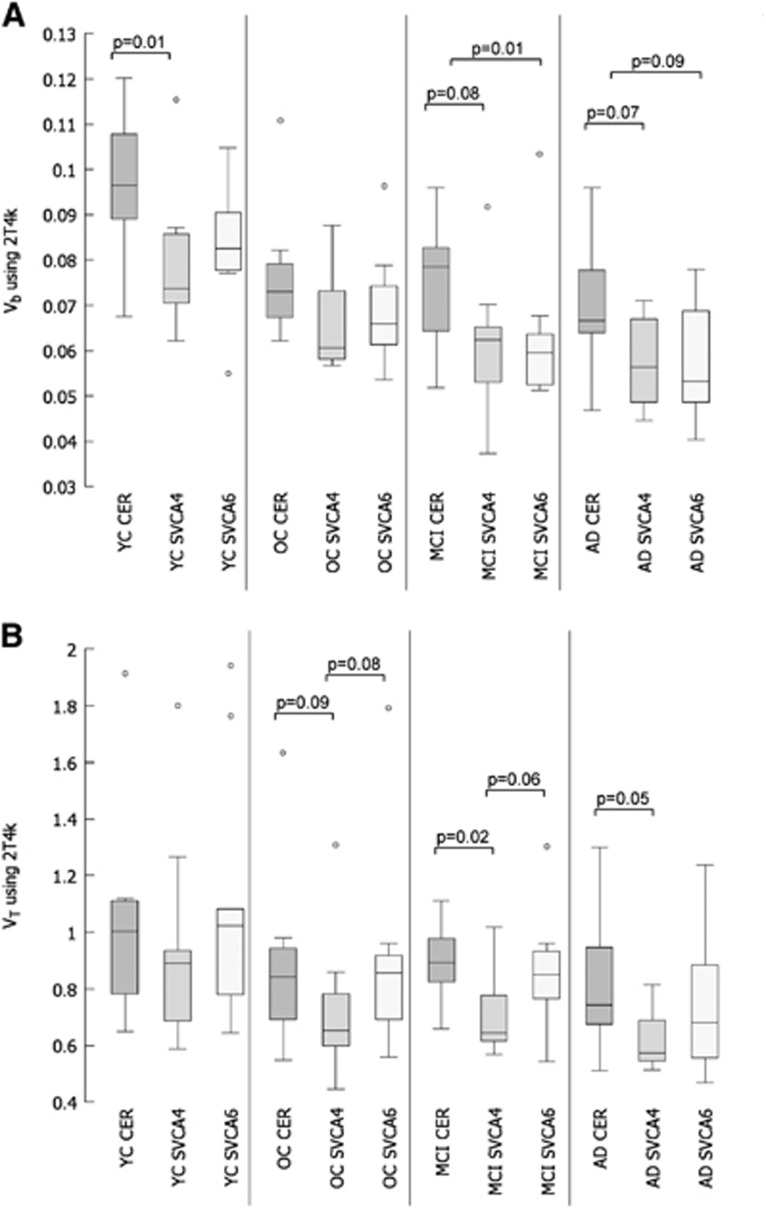
Figure 3.
Comparison of reference tissue Vb (A) and VT (B) using box and whisker plots, including two-tailed T-test analysis for comparison between methods. Reference tissue time-activity curves (TACs) were based on manually drawn gray+white-matter cerebellum (CER), and those extracted automatically using SVCA4 and SVCA6. Data were taken from young controls (YC), old controls (OC), and patients with mild cognitive impairment (MCI) and Alzheimer's disease (AD). Note that all two-tailed T-tests were performed after removing the outliers (marked with open circles) shown in the figure.

