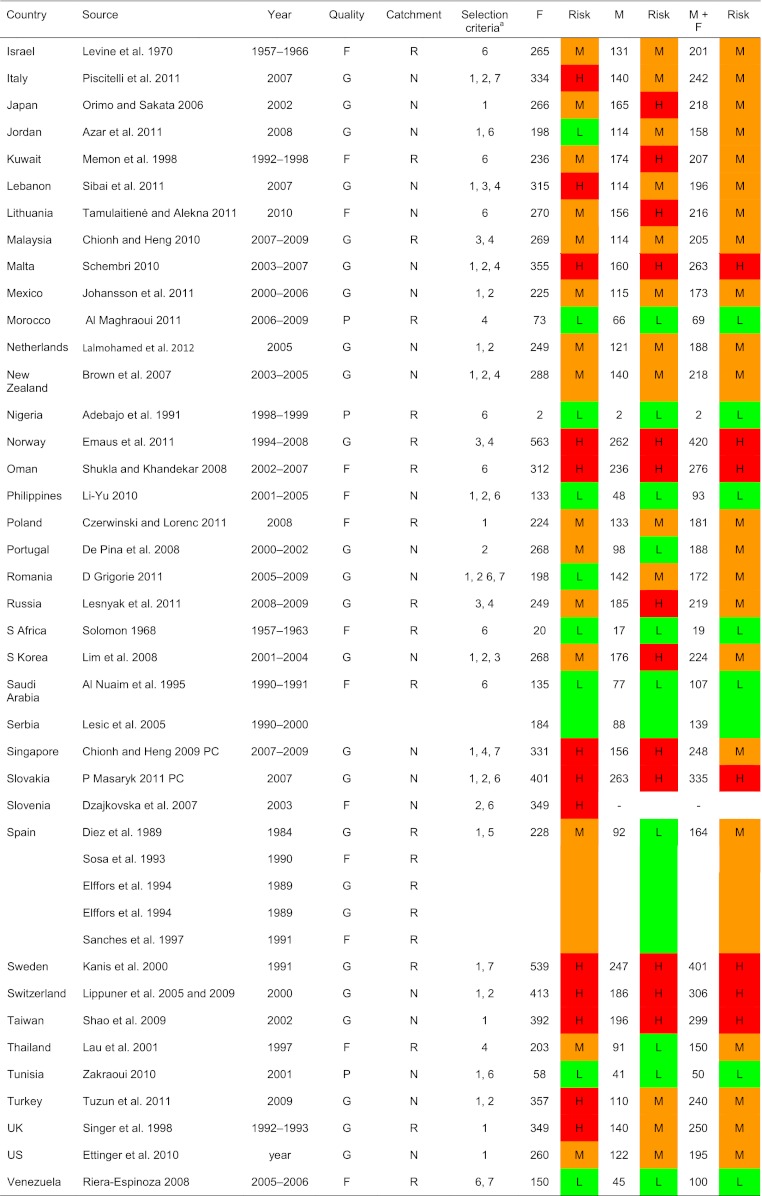
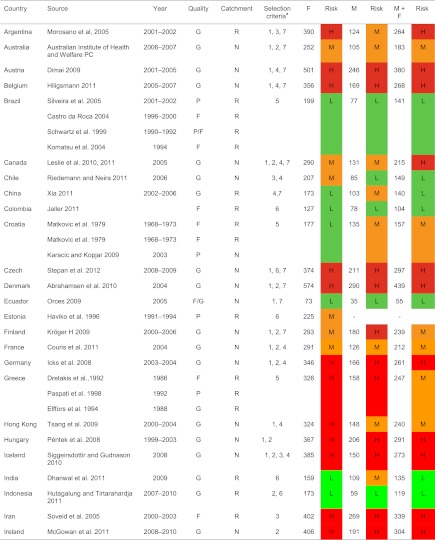
Table 5.
World age-standardised hip fracture rates (/100,000) and risk categories

H high, M moderate, L low (see table above for thresholds of risk), G good, F fair, P poor, N national, R regional, 1 FRAX model available, 2 national rather than regional data, 3 higher quality than other studies, 4 most recent study, 5 mean of several regional estimates, 6 sole study available, 7 additional details supplied by the author, see notes in tables
aSelection criteria—see “Methods”

