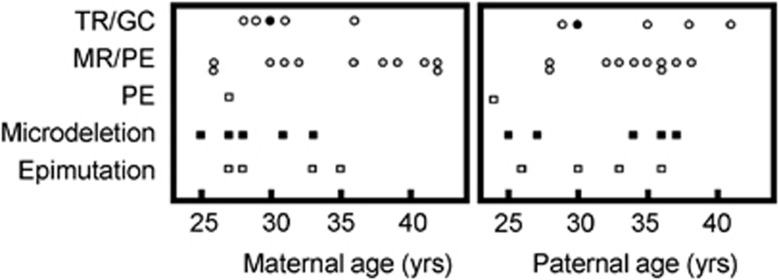
Figure 2.
The distribution of parental ages at childbirth according to the underlying genetic causes for the development of UPD(14)pat-like phenotype and UPD(14)pat subtypes. Of the five plots for the TR/GC subtype, open and black circles indicate the TR/GC subtype due to non-disjunction at paternal M1 and M2, respectively.

