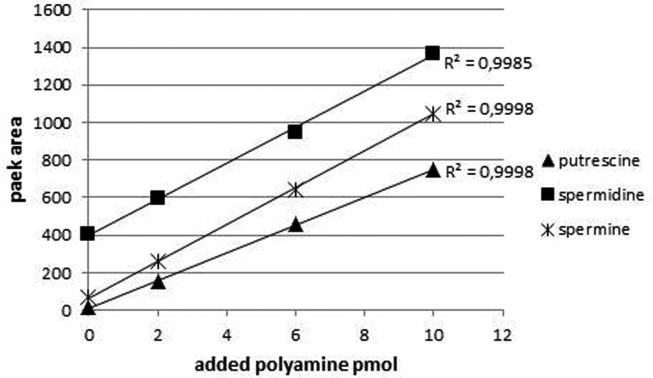
Figure 3.
Typical calibration curves for the PAs of interest quantified by standard addition method. Leaf extracts were supplemented with different amounts of PAs. The curves are linear and the correlation coefficient for all three compounds is above 0.999. The ordinate indicates the fluorescence intensity: excitation at 265 nm; emission at 320 nm.

