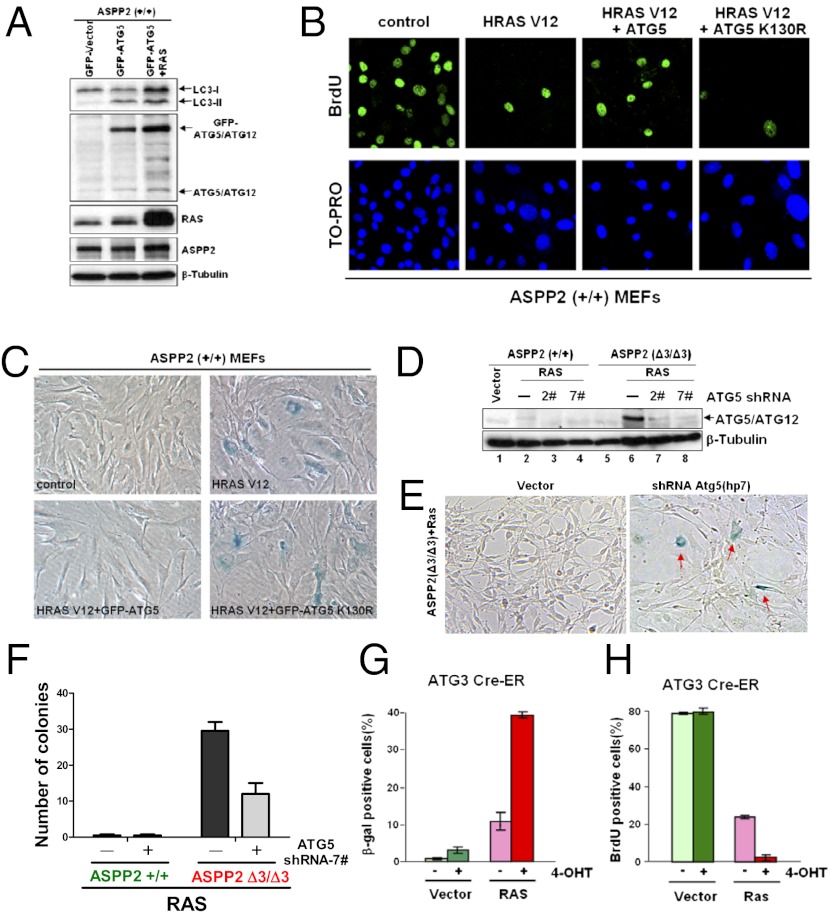
Fig. 3.
High levels of autophagy bypass oncogenic RAS-induced senescence, whereas a reduced level of autophagy sensitizes to it. (A) Western blot shows the expression of LC3I/LC3II, endogenous ATG5/ATG12, GFP-ATG5/ATG12, RAS, and ASPP2 in ASPP2(+/+) MEFs with the indicated treatments. β-Tubulin expression levels demonstrate equal loading. (B and C) Overexpression of ATG5, not the ATG5 K130R mutant, is sufficient to overcome oncogenic RAS-induced senescence. ASPP2(+/+) MEFs with the indicated infections were stained for BrdU incorporation (B) or SA-β-gal activity (C) 1 wk after infection. Images for BrdU incorporation were taken with a ×63, oil-immersion objective lens while images for SA-β-gal activity were taken with a ×20, air objective lens. (D) Western blot analysis of lysates from indicated MEFs demonstrates that the amount of ATG5/ATG12 protein is reduced by two independent shRNA constructs (2# and 7#) against ATG5. (E) Knockdown of ATG5 restores senescence in oncogenic HRAS V12-expressing ASPP2(Δ3/Δ3) MEFs, as indicated by the presence of SA-β-gal–stained senescent cells (red arrows). Images were taken with a ×20, air objective lens. (F) Graph shows the number of colonies formed by HRAS V12-expressing ASPP2(+/+) or ASPP2(Δ3/Δ3) MEFs infected with control shRNA or shRNA against ATG5 (7#). (G and H) Deletion of ATG3 accelerates RAS-induced senescence. ATG3 Cre-ER MEFs were first treated without or with 200 nM 4-OHT for 4 d, followed by infection with or without HRAS V12 for 1 wk. Graphs show the percentage of SA-β-gal–positive (G) or BrdU-positive (H) cells with indicated infections.

