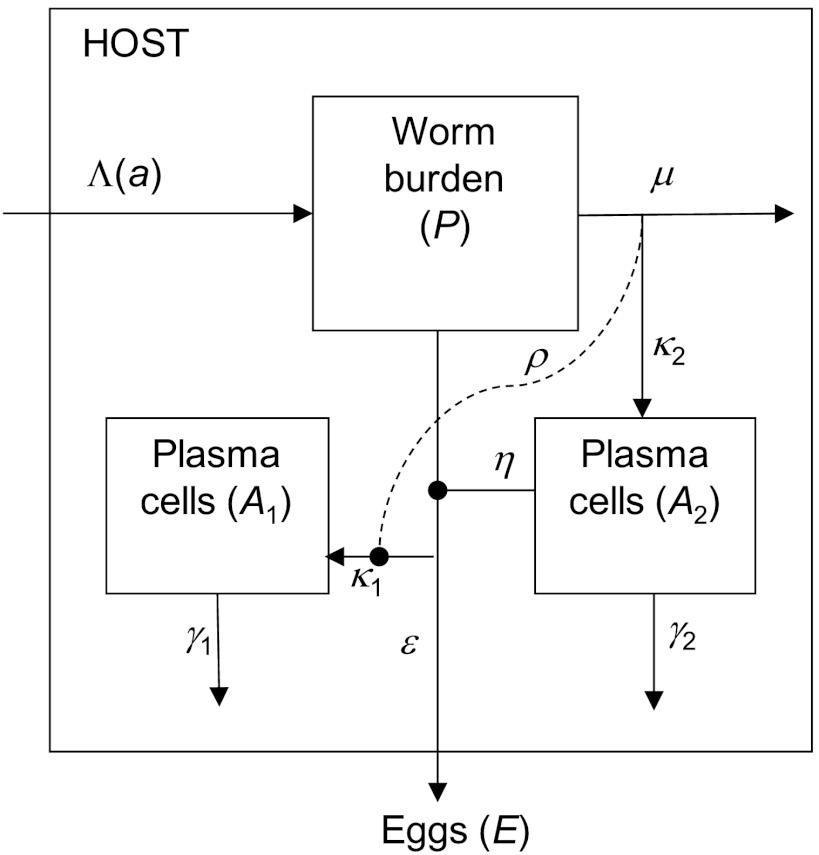
Fig. 4.
Schematic diagram of the model. This shows the main state variables, worm burden (P), and two populations of plasma cells (A1 and A2), with production of eggs (E). A single worm compartment is shown for clarity. Cross-regulation of the nonprotective response (of strength ρ) is shown by the dashed line.

