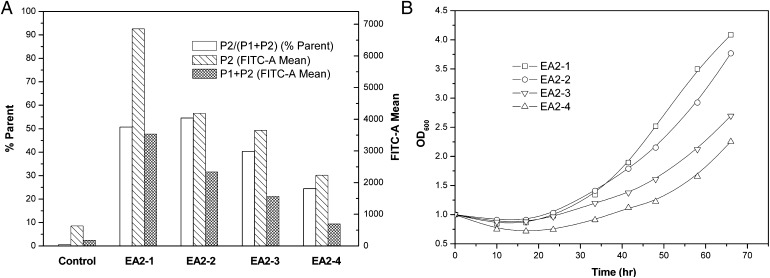
Fig. 3.
Display level of miniscaffoldin II on the yeast cell surface (A) and cell growth curves during induction (B). Yeast cells were probed with mouse anti–V5-FITC monoclonal antibody. P1 was the negatively staining population, whereas P2 was the positively staining population (see Fig. 2, FACS).

