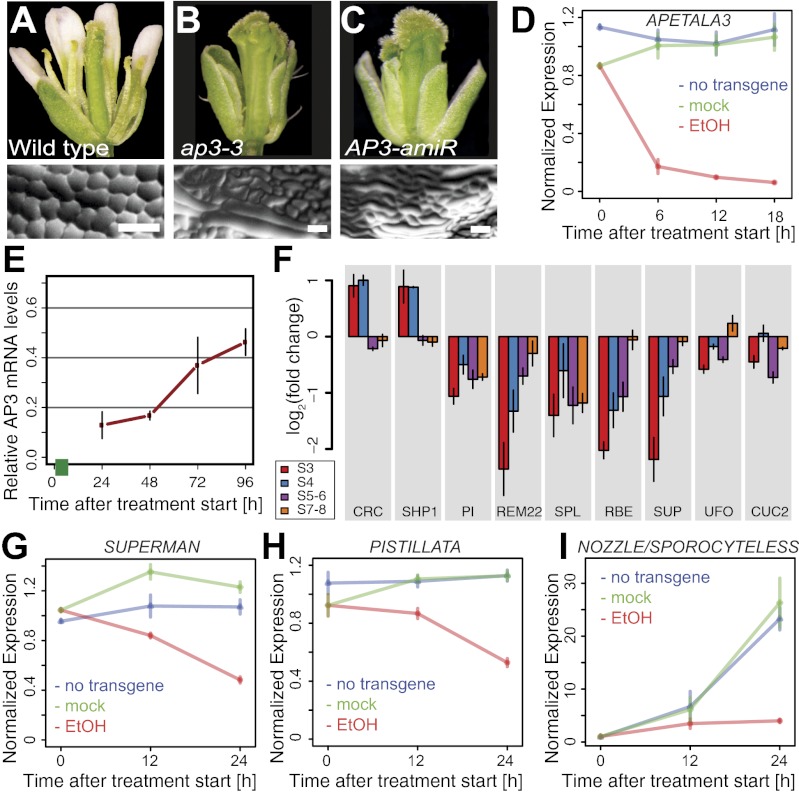
Fig. 2.
Effects of an inducible AP3 knockdown. (A–E) Characterization of a line expressing an ethanol-inducible amiRNA against AP3. (A) WT flower. (B) ap3-3 mutant flower. (C) Flower of a 35S:AlcR/pAlcA:AP3-amiRNA plant in which amiRNA expression had been induced by two 24-h treatments (at an interval of 4 d) with ethanol vapor. (D) Knockdown of AP3 mRNA levels in the floral induction system upon ethanol treatment. Plants were treated with ethanol vapor 3 d after induction of flower formation, or were mock-treated, for different time periods (as indicated). (E) Recovery of AP3 mRNA accumulation after a pulsed induction of AP3-amiRNA expression in the floral induction system. Plants were exposed to ethanol vapor for 6 h (green bar) 2 d after the induction of flower development. Following an 18-h recovery period, tissue was collected at different time points (as indicated), and AP3 mRNA levels relative to those in mock-treated flowers were determined. (F) Expression of selected genes (SI Appendix, Table S3, includes full gene names) in flowers of different stages (s) after an amiRNA-mediated AP3 knockdown. AP3 mRNA levels in these flowers were compared with corresponding flowers with unimpaired AP3 activity. (G–I) Transcriptional response of selected genes known or suspected to act downstream of the B function regulators after induction of AP3-amiRNA expression in the floral induction system. Plants were treated with ethanol (EtOH) vapor 3 d after induction of flower formation or mock-treated for different time periods (as indicated). In D and G–I, AP3 mRNA levels were normalized against the mean expression in flowers of ethanol and mock-treated plants carrying the 35S:AlcR/pAlcA:AP3-amiRNA transgene, as well as in flowers of control plants lacking that transgene, at the 0 h time point. Bars indicate SEM of four (D) or three (E–I) independent quantitative RT-PCR experiments.

