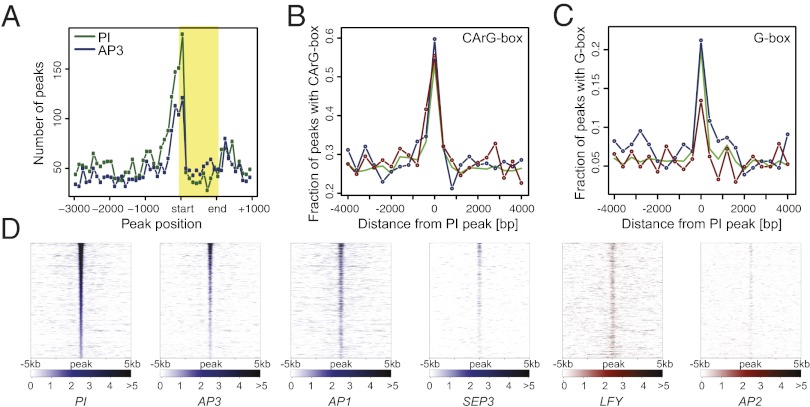
Fig. 5.
Genomewide binding data for AP3/PI. (A) Distribution of binding sites around transcription start sites. Plot showing the number and relative distribution of ChIP-Seq peaks in the proximity (from 3,000 bp upstream to 1,000 bp downstream) of transcribed regions of potential target genes. Binding site positions within transcribed regions (shaded box) were normalized relative to their length. Distribution of CArG (B) and G-boxes (C) within 400-bp windows around PI binding sites in the promoters of up-regulated (blue line) or down-regulated (red line) genes, or of all genes in the dataset (green line). (D) Comparison of binding data for selected floral regulators. Heat maps show binding data from different ChIP-Seq experiments for genomic regions surrounding 1,852 high-confidence PI binding sites (data for MADS domain proteins are shown in blue, and data for LFY and AP2 in red). Normalized Poisson enrichment scores are depicted in a color-code scale. All data were sorted (from top to bottom) according to descending PI peak height.

