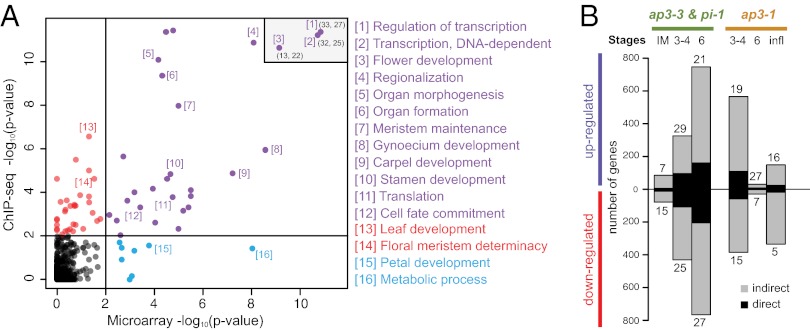
Fig. 6.
Correlation between GO terms enriched in the microarray and ChIP-Seq datasets. (A) Plot showing the correlation between GO terms identified in null mutant microarray (combined data from ap3-3 and pi-1; 5-d time point) and ChIP-Seq (PI) experiments. Selected terms are labeled (Dataset S4 provides a full list). For three highly significant terms, rounded coordinates (x;y) are listed in the upper right corner. (B) Proportion of direct targets among genes identified as up- or down-regulated in the ap3-3 and pi-1 experiments and in the ap3-1 experiment.

