Fig. 3.
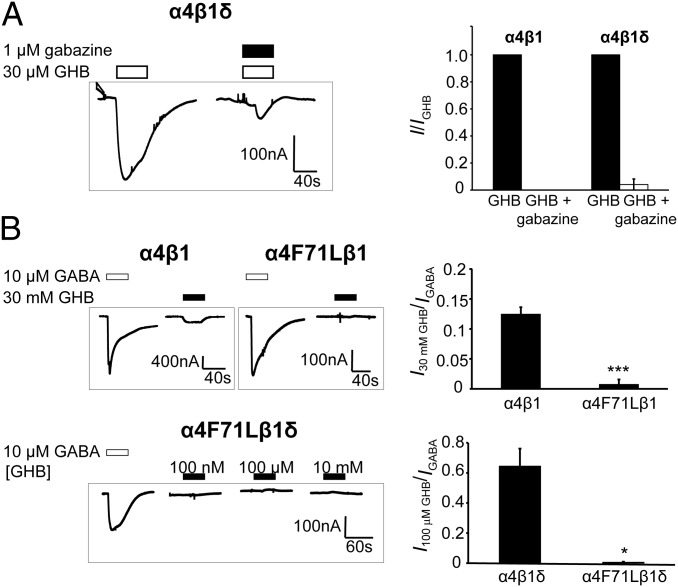
Abolishment of GHB response by gabazine coapplication and α4F71L point mutation. (A, Left) Representative gabazine inactivation trace of GHB currents at α4β1δ. (A, Right) Summarized data displaying fraction of GHB current at α4β1/δ (means ± SEM; n = 3). (B, Left) Representative traces of GABA and GHB-elicited currents from α4β1, α4(F71L)β1 (Upper), and α4(F71L)β1δ (Lower). (B Right) Summary (means ± SEM) of 30 mM GHB effects at α4β1 vs. α4(F71L)β1 (***P = 6.3 × 10⁻⁵) and 100 μM GHB at α4β1δ vs. α4(F71L)β1δ (*P = 0.011).

