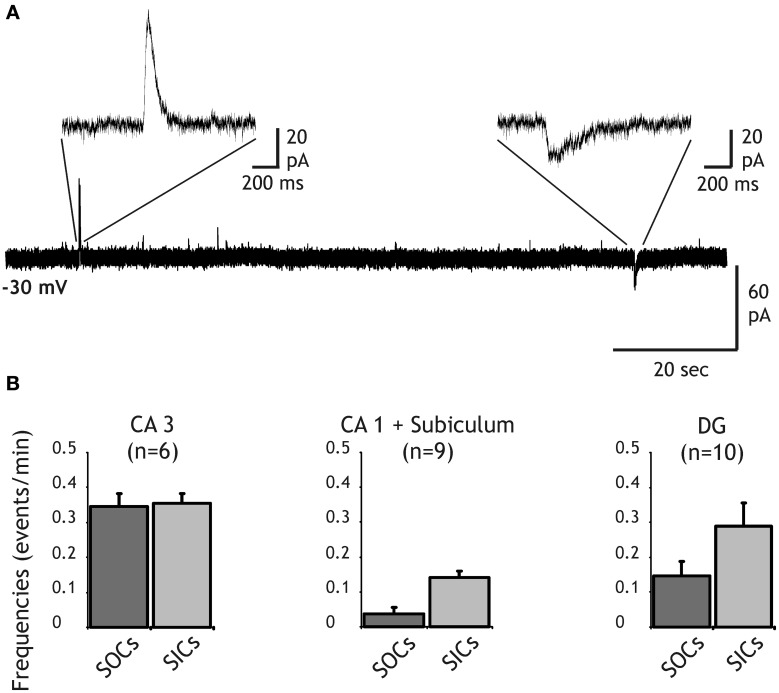
Figure 1.
Distribution of SIC and SOC frequencies in principal neurons of the hippocampus. (A) Recording from a dentate gyrus granule cell held at a membrane of −30 mV in the presence of TTX (1 μM) and NBQX (10 μM). A slow outward current (SOC) and a slow inward current (SIC) are shown with an expanded time scale. (B) Frequency histograms of SOCs (dark bars) and SICS (light bars) recorded in pyramidal cells of CA3 (left), CA1 and the subiculum (middle) and in granule cells of the dentate gyrus (right).

