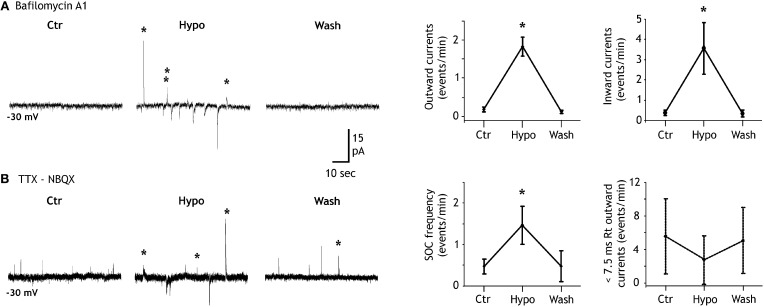
Figure 3.
Hypotonicity increases SIC and SOC frequencies. (A) Left, example of a granule cell recorded in a bafilomycin A1 treated slice and illustrating the increase of the SOC (labeled with stars) frequency induced by a 20% reduction of the extracellular solution osmoloraty. Note that hypotonicity also increases the frequency of the slow inward currents (SICs). Right, quantification of the effect induced by hypotonic solutions for six granule cells. (B) Same as in A but in a control slice. Note that the hypotonic solution increases the frequency of SOCs (stars) but not that of synaptic currents (unlabeled outward currents). Right, quantification of the effect induced by hypotonic solutions on the frequency of SOCs (10–90% rise time >7.5 ms; n = 8 granule cells; left graph) and on that of miniature IPSCs (10–90% rise time <7.5 ms; same granule cells; right graph).

