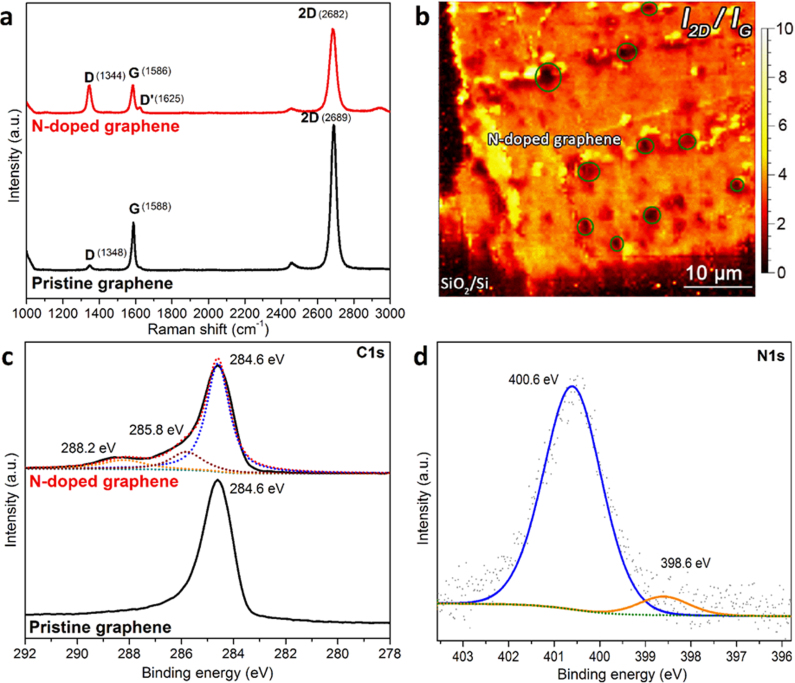
Figure 2. Raman spectroscopy and X-ray photoelectron spectroscopy (XPS) characterizations of as-synthesized NG and pristine graphene samples.
(a) Typical Raman spectra of N-doped and pristine graphene on SiO2/Si substrate. The wavelength of Raman laser line is 514 nm. (b) 2D-band to G-band intensity ratio (I2D/IG) mapping of NG on SiO2/Si substrate. The NG sample is composed of a majority of single-layer sheets and some bi-layer or tri-layer islands, as highlighted with dark circles in the image. (c) XPS C1s line scan of N-doped and pristine graphene. The main peak at 284.6 eV corresponds to the graphite-like sp2 C, indicating most of the carbon atoms are arranged in honeycomb lattice. The small peaks at 285.8 and 288.2 eV can be attributed to C-N bonding and oxygenated groups structures. (d) N1s line scan of NG sample, which confirms the presence of substitutional (400.6 eV) and pyridine-like (398.6 eV) nitrogen dopants. The dashed green line exhibits the Shirley background.

