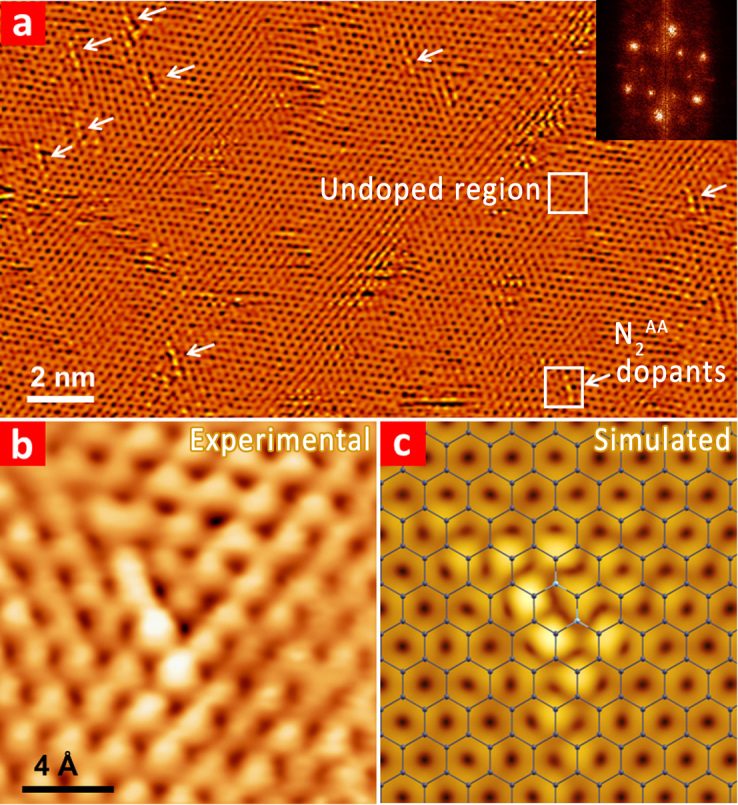
Figure 3. Experimental and simulated STM images of as-synthesized NG sheets.

(a) Large-area STM image of the NG illustrating the presence of numerous N-dopants with similar peapod-like configuration (highlighted by white arrows), Vbias = −75 mV, Iset = 100 pA. The upper and lower squares are used to indicate the undoped region and N2AA dopants. (Inset) FFT of topography presents reciprocal lattice (outer hexagon) and intervalley scattering (inner hexagon). The STM image shown here is obtained in flattening mode to remove the overall roughness of the substrate and enhance the atomic contrast of dopants. (b) Highly resolved STM image of a N2AA dopant. (c) Ball-stick structural model of the N2AA dopant and simulated STM image obtained using first-principles calculations. The bias is −1.0 eV. The carbon and nitrogen atoms are illustrated using gray and cyan balls, respectively.
