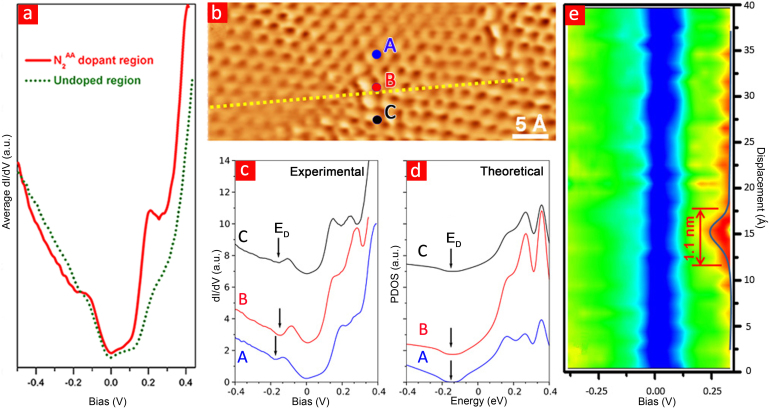
Figure 5. Local electronic characteristics of NG sheets.
(a) dI/dV curves measured on N2AA dopants (red solid curve) and on undoped graphene region (olive dot curve). Both dI/dV spectra were averaged over 9 point spectra taken in 1×1 nm2 area. All STS data were obtained using a lock-in technique. (b) An STM topographic image including two N2AA dopants. (c) dI/dV curves located at the center of N2AA dopant (point B) and measured 5 Å away (points A and C). (d) Theoretical calculation of the PDOS on and near a N-dopant. The position of the Dirac point (ED) in the calculated PDOS (d) is shifted to the experimental location for clarity. (e) A color spectra mapping across one of the dopant, as illustrated by the yellow dashed line in panel (b). The electronic perturbation induced by the N-dopant is clearly localized within ~1 nm.

