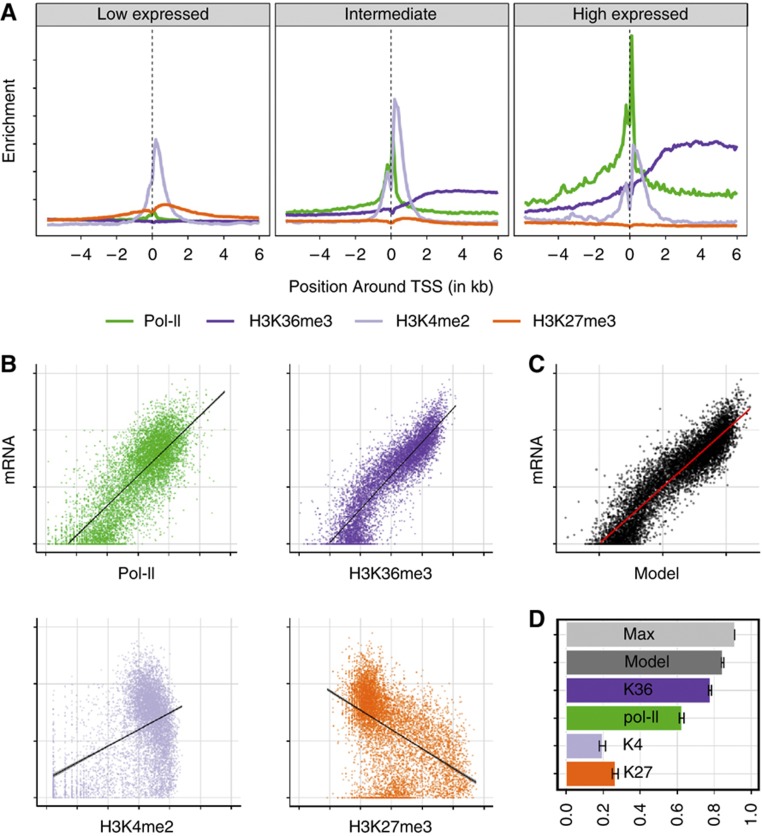
Figure 1.
Using histone marks and RNA polymerase II to model mRNA levels. (A) Metagene plot showing the distribution of histone marks along the gene body of genes aligned at their TSS with low, intermediate, and high expression levels. (B) Scatter plot of RNA polymerase II (Pol-II, green) and three histone marks H3K36me3 (dark blue), H3K4me2 (light blue), H3K27me3 (orange) versus mRNA levels on the vertical axis. The number of reads aligned to either gene body (H3K36me3, mRNA) or at the TSS (H3K4me2, H3K27me3, Pol-II) is shown in logarithmic scale. (C) Predicted transcription rate combining the four measures in a linear model versus mRNA level. Axes as in (B). (D) Bar plot showing the fraction of total variance in mRNA levels that is explained by each single histone mark, Pol-II occupancy or a linear combination of them (dark gray). The maximally explainable variance (light gray) is limited by the amount of measurement noise (see Supplementary information section 4 for details). Error bars indicate 95% confidence interval.

