Figure 4.
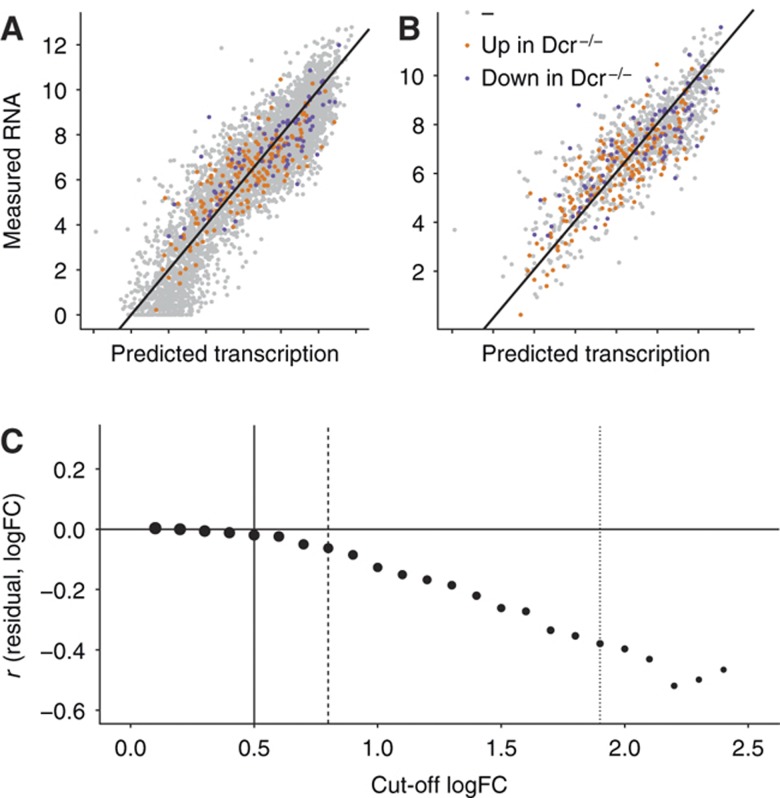
Focus on high-confidence microRNA target genes. (A) Same plot as in Figure 1C. All RefSeq genes are classified into three color-coded groups according to upregulated in Dicer−/− (orange), downregulated in Dicer−/− (purple), and unchanged (gray). (B) Subset of all the genes in (A), where the absolute log fold-change (logFC) between Dicer−/− and Dicer+/− is >0.5. This subset contains likely targets and non-targets. (C) Pearson correlation (r) between the residual of the linear model and the logFC between Dicer−/− and Dicer+/− (see Supplementary information section 7 for details) as a function of cutoff in absolute logFC between Dicer−/− and Dicer+/−. A logFC cutoff of zero corresponds to (A), and a cutoff of 0.5 (solid vertical line) corresponds to (B). Correlations are shown for subsets of genes for logFC cutoffs incremented in 0.1 intervals. The point size illustrates the number of genes at each cutoff. At 0.8, the subset contains 1000 genes (dashed line), the subset at 1.9 contains 100 genes (dotted line). Increasing logFC cutoffs select higher confidence microRNA-target genes that can explain the residual of the linear fit increasingly better.

