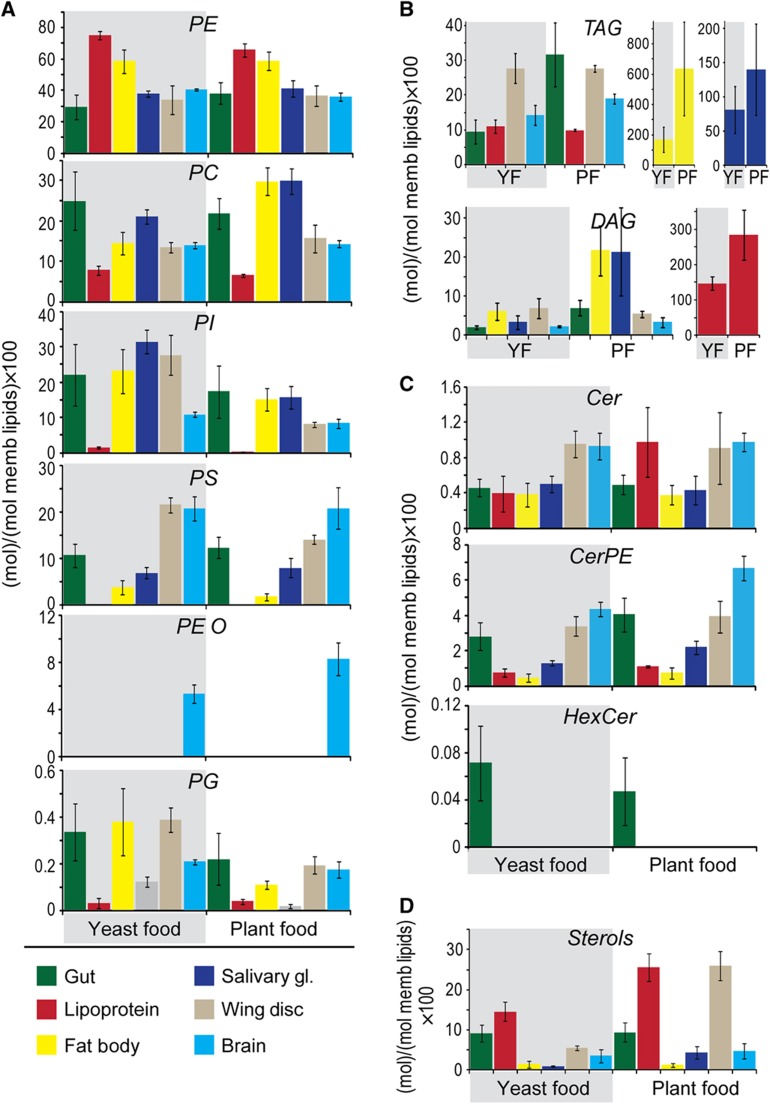
Figure 4.
Effect of diet on lipid class abundance in different tissues. (A–C) The amount of each lipid class in the different tissues and lipoproteins of early wandering third instar larvae fed either YF (shaded in gray), or PF (not shaded). Tissues are indicated with color, as shown. Lipid class amount is calculated as mol% with respect to total membrane lipids Membrane lipids include phospholipids, sphingolipids and sterols, but not TAG and DAG. (A) Phospholipids (B) Neutral lipids (C) Sphingolipids (D) Sterols. Error bars indicate standard deviation.

