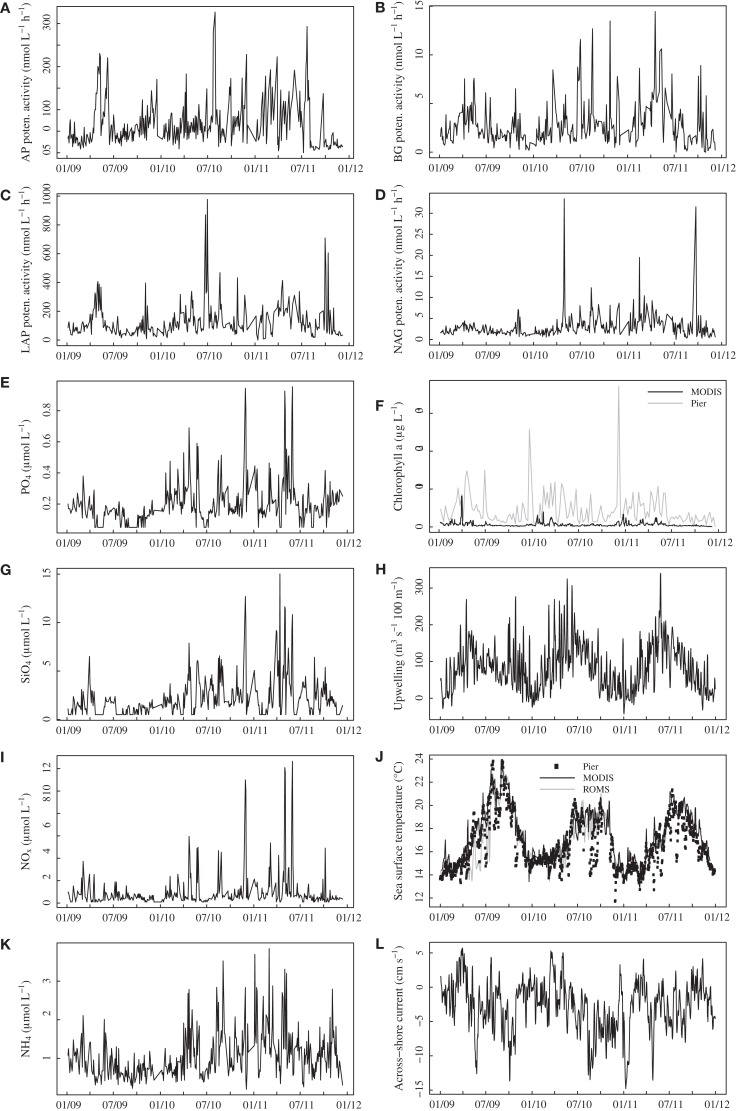
Figure 1.
Time series plots for bulk seawater extracellular enzyme activities (A–D) and seawater nutrient concentrations (E,G,I,K) in surface water at Newport Pier. Chlorophyll a data (F) are derived from MODIS satellite data for a ∼3600-km2 region surrounding Newport Pier (black line) or from surface water samples taken weekly at the pier (gray line). Sea surface temperatures (J) are from an automated sensor at Newport Pier (squares), MODIS satellite data from the 3600-km2 region (black line), and ROMS model output from the 3600-km2 region. The Bakun upwelling index (H) is shown for the Southern California Bight at 33°N, 119°W. Across shore (L) currents were derived from ROMS model outputs (surface 50 m) for the 3600-km2 region. AP, alkaline phosphatase; BG, β-glucosidase; LAP, leucine aminopeptidase; NAG, N-acetyl-glucosaminidase.

