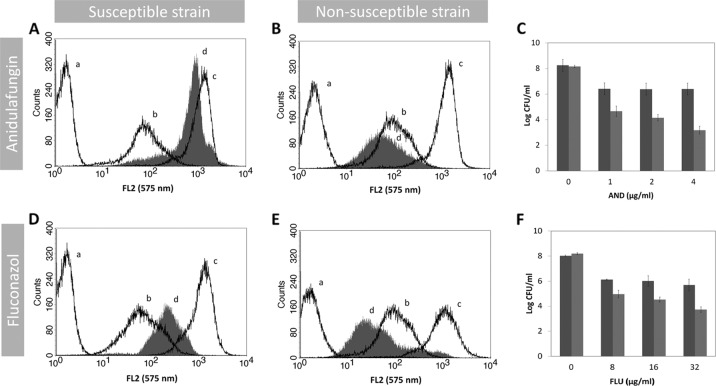
Fig 2.
In vitro antifungal activities of anidulafungin and fluconazole. Distribution of fluorescence intensity of C. albicans 0207 AND-susceptible strain (A), C. parapsilosis 0136 AND-nonsusceptible strain (B), C. albicans O223 FLU-susceptible strain (D), and C. albicans O216 FLU-nonsusceptible strain (E). In each histogram, the autofluorescence is represented by line a, line b represents the fluorescence of untreated cells stained with FUN-1, line c is the fluorescence of cells treated with 70% ethanol and stained with FUN-1 (positive control), and line d is the fluorescence of cells treated with antifungal drugs (1 μg/ml of ANI and 16 μg/ml of FLU) during 1 h and stained with FUN-1. (C, F) Determination of the number of CFU (CFU/ml) of cell suspensions treated with different antifungal concentrations under conditions identical to those of the flow cytometric assay. The nonsusceptible strain is represented by the dark-gray bars and the susceptible strain by the light-gray bars.

