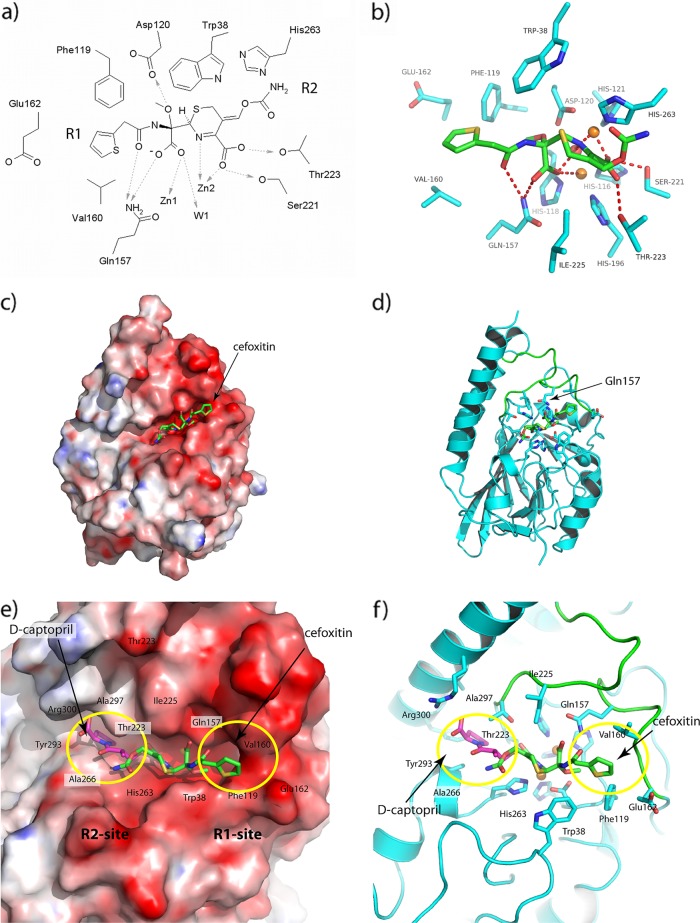
Fig 4.
Interactions between hydrolyzed cefoxitin and AIM-1 in the optimized protein-drug complex after the QM/MM calculations. (a and b) Views of active site shown (a) as a schematic and (b) in the context of the structure. (c) Calculated electrostatic surface of (DelPhi) (48) AIM-1. (d) Ribbon diagram showing location of the active site. The color coding is red, white, and blue, representing the charges of −10, 0, and +10 KbT/e, and the docked hydrolyzed cefoxitin (green) is included in both panels. (e and f) Closeup views of cefoxitin (green) and d-captopril (magenta) docked into the AIM-1 active site as described here. R1 and R2 binding sites are shown with (e) and without (f) the electrostatic surface. Residues 156 to 162 and 223 to 230 are shown in green.

